The CRB Index Paints A Bleak Picture For Commodities | Silver, Natural Gas

Trade wars are clearly taking their toll on markets. Yet the bigger picture for the CRB index (and therefor its components) suggests it may have seen a cyclical top.
Whilst the bleeding on equities has slowed to a degree, the weakness among commodities overall cannot go unnoticed. For this we can take a broad look at a commodity basket called the Thomson Reuters CoreCommodity CRB, which is made up of 19 components and essentially the Dow Jones Industrial Average for commodities. Whilst energy accounts for the largest sector within the index at 39%, agriculture is close behind at 34% and metals at 20%. However, whilst the ongoing trade war between US and China persists, agriculture and metals are arguably going to face the most pressure within the index.
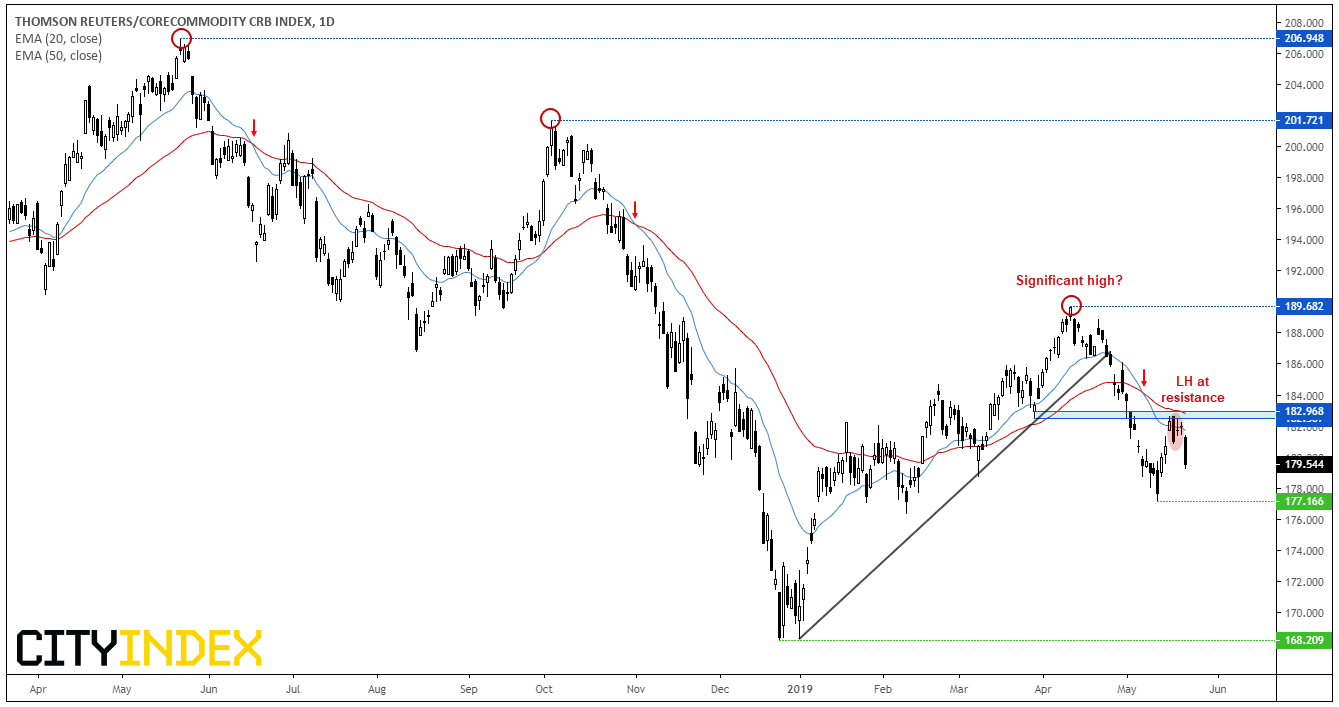
On the daily chart we can see the CRB index has broken a bullish trendline, plummeted -6.6% and printed a lower since its 189.68 high. Since finding resistance at the 20 and 50-day eMA’s and 183 lows, price action has been reminiscent of a swing trade. Furthermore, the longer-term picture suggests the 189.68 swing could be significant and comparable to the 201.72 and 206.95 highs, all of which have been followed by a death cross from the moving averages. If so, it suggests some commodities could break to new lows. Below are two markets which we have a bearish bias on over the near-term, until key levels of resistance break.
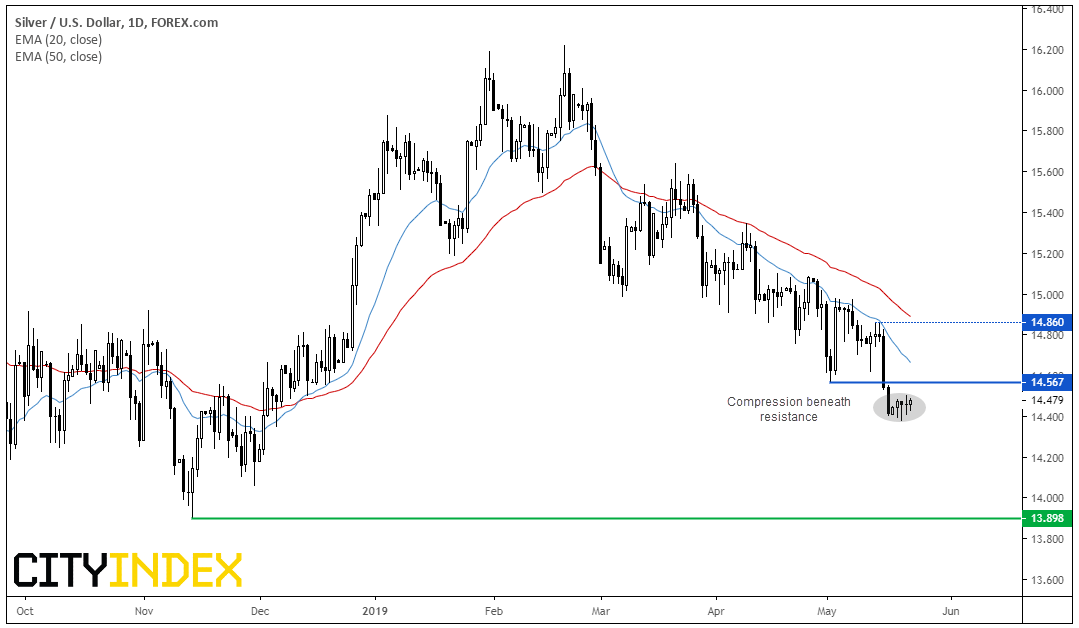
Silver: The daily chart has been grinding lower since mid-February, yet last week prices saw a clear break of key support at $14.56. With prices now consolidating beneath this key level, we’re looking for bearish momentum to return and break it out of compression. A clear break above $14.56 places it on the backburner, although the trend remains technically bearish below Gold could also be looking to break lower.
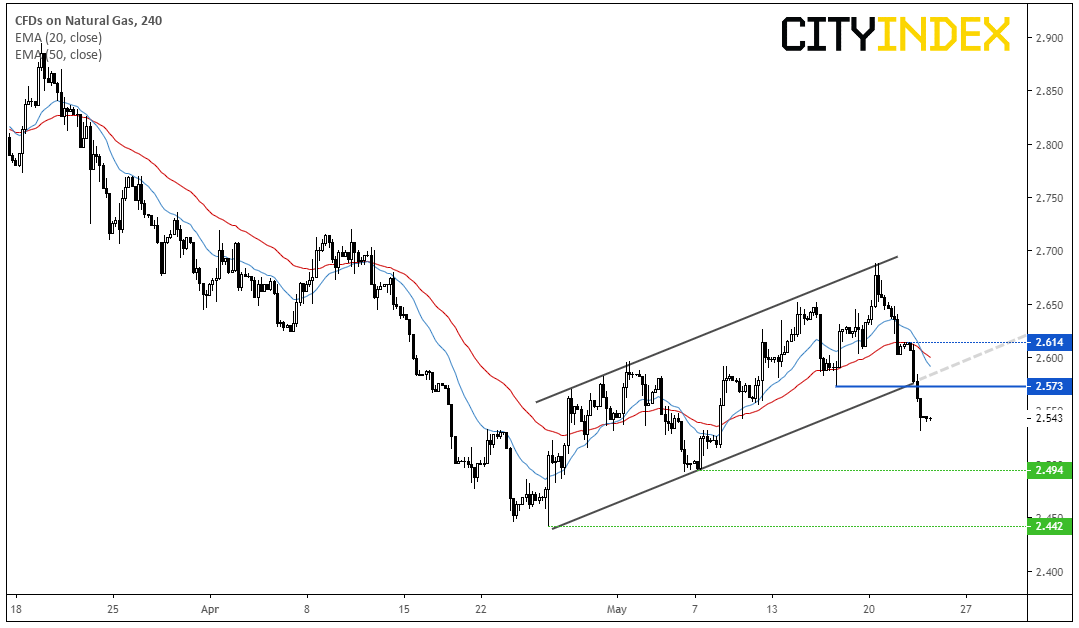
Natural gas: The four-hour chart has seen a breakout of its bearish channel. Prices appear over-extended to the downside over the near-term, but bears could look to fade into rallies. Ideally any rebound will remain beneath the 2.57 low, however we could also use the broken channel as a rising resistance line to fade into if necessary (or await bearish momentum to return after respecting a key level).
Author

Matt Simpson, CFTe, MSTA
CityIndex
Matt Simpson is a certified technical analyst who combines charts and fundamentals to generate trading themes.


