The Chart of the Week: AUD/USD to test below a 50% mean reversion
- AUD/USD has the makings for a 1:3 risk to reward trade to the downside.
- Bears will seek a deep Fibonacci retracement to the confluence of demand territory.

AUD/USD has been correcting a small portion of the daily impulse.
In doing so, the price penetrated the early October highs to make way for at least a 38.2% Fibonacci retracement.
However, there has been a meanwhile bid back to test the resistance structure to pick up some last-minute liquidity.
The following is illustrating how bears could be positioning for a rin to the downside and beyond a 38.2% Fibo towards the 2020 Point of Control, (POC) and confluence zones.
Daily chart
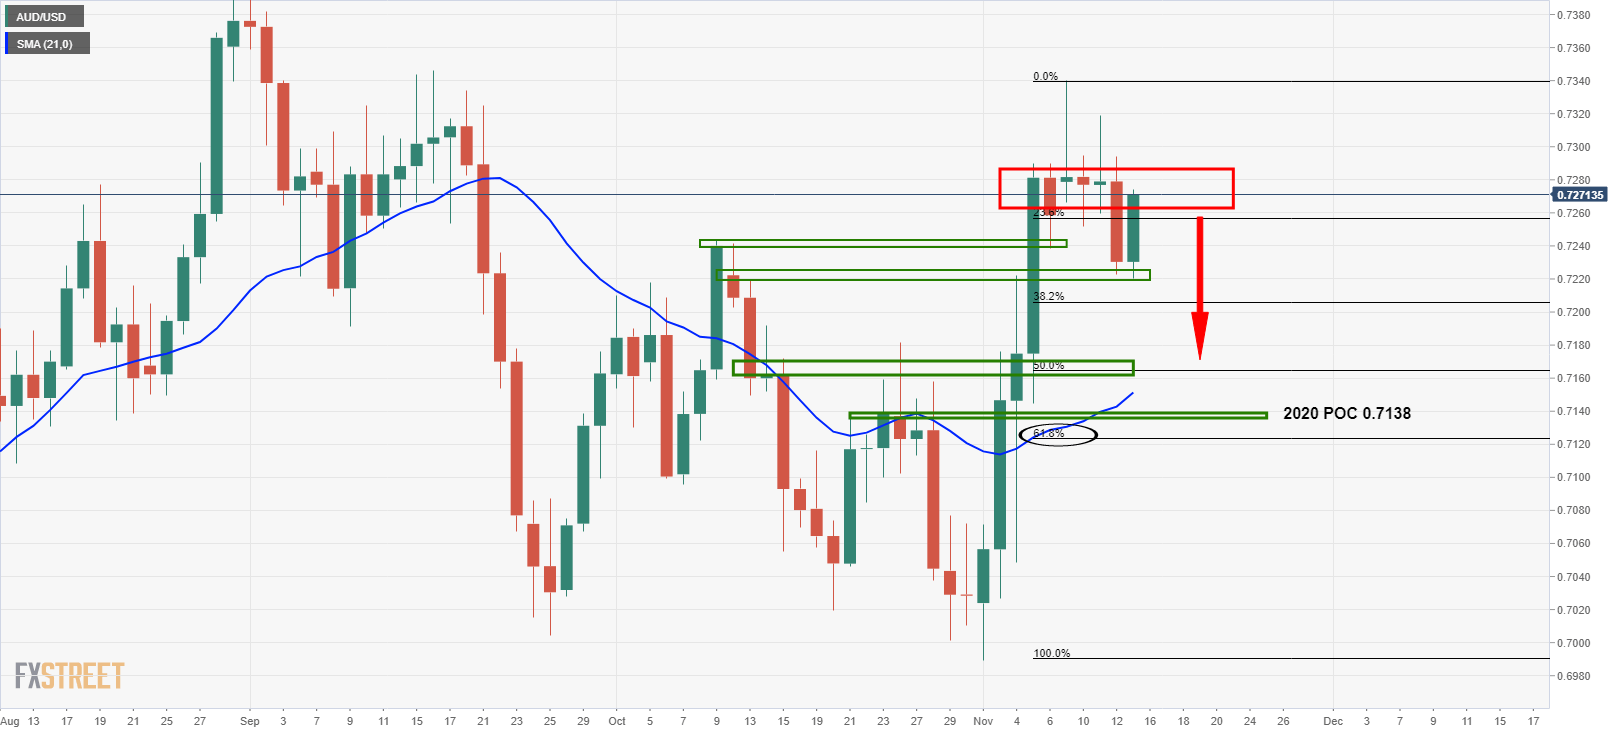
The daily chart is bearish with multiple failures within the supply zone.
Bears will be seeking a break of the latest support structure for the possibility to move the positing into a breakeven scenario targeting structure below.
4-hour chart
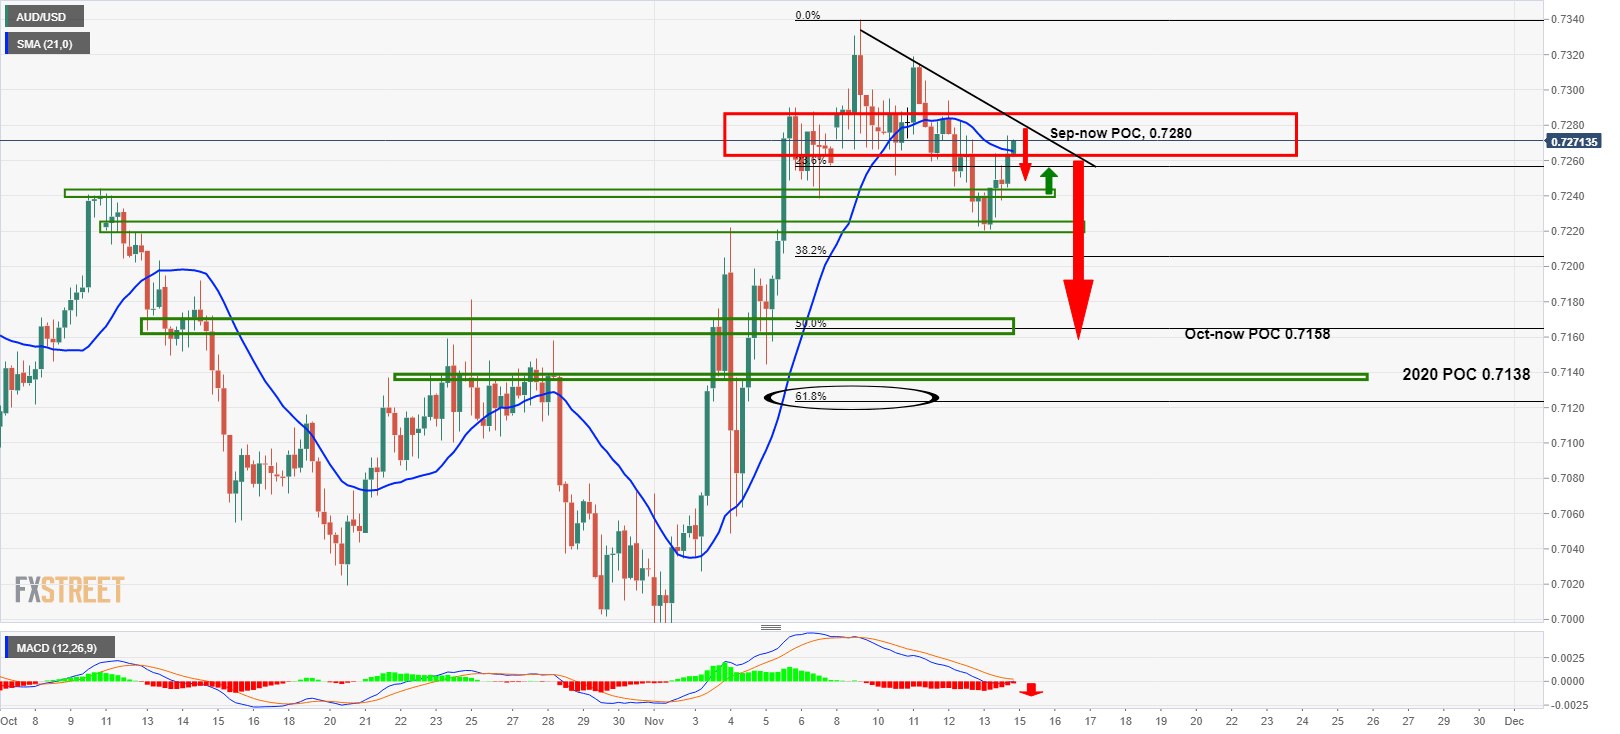
Bears can look to short from the recent highs, with a stop above the structure and for a minimum 1:3 risk to reward target towards daily supporting areas, such as the confluence zones and POC.
We have a series of confluence zones, which include the 50% and 61.8% Fibonacci retracements that marry with high demand areas, the 21-day moving average and prior support and resistance levels.
Author

Ross J Burland
FXStreet
Ross J Burland, born in England, UK, is a sportsman at heart. He played Rugby and Judo for his county, Kent and the South East of England Rugby team.


