The Bulls Still on Break

Good Morning Traders,
As of this writing 5:55 AM EST, here's what we see:
US Dollar: June USD is Up at 97.930.
Energies: June '19 Crude is Up at 63.41.
Financials: The Jun 30 year bond is Up 1 tick and trading at 149.13.
Indices: The June S&P 500 emini ES contract is 51 ticks Higher and trading at 2857.00.
Gold: The June Gold contract is trading Down at 1275.30. Gold is 20 ticks Lower than its close.
Initial Conclusion
This is not a correlated market. The dollar is Up+ and Crude is Up+ which is not normal and the 30 year Bond is trading Higher. The Financials should always correlate with the US dollar such that if the dollar is lower then bonds should follow and vice-versa. The S&P is Higher and Crude is trading Higher which is not correlated. Gold is trading Lower which is correlated with the US dollar trading Up. I tend to believe that Gold has an inverse relationship with the US Dollar as when the US Dollar is down, Gold tends to rise in value and vice-versa. Think of it as a seesaw, when one is up the other should be down. I point this out to you to make you aware that when we don't have a correlated market, it means something is wrong. As traders you need to be aware of this and proceed with your eyes wide open.
Asia is trading Mixed with half the exchanges trading Higher and the other half Lower. Currently all of Europe is trading to the Upside.
Possible Challenges To Traders Today
-
Existing Home Sales is out at 10 AM EST. This is major.
-
FOMC Member Evans Speaks at 10:45 AM EST. This is major.
-
FOMC Member Rosengren Speaks at 12 Noon EST. This is major.
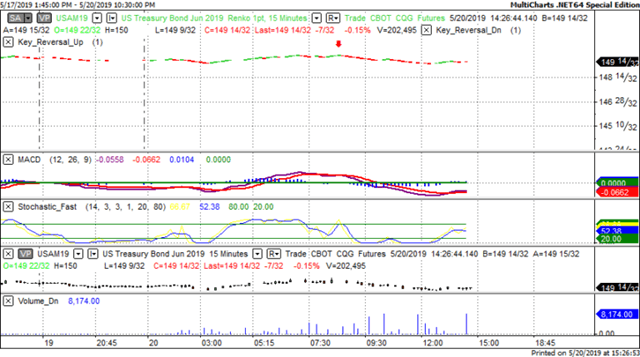
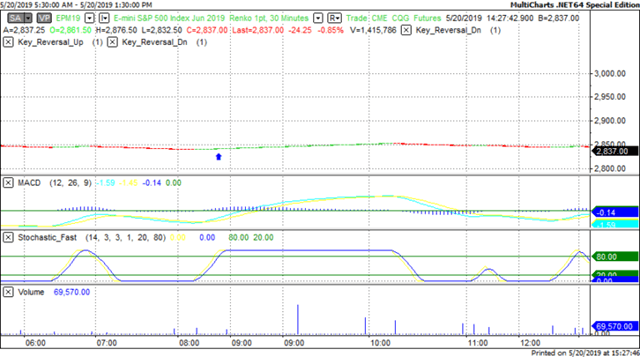
Treasuries
We've elected to switch gears a bit and show correlation between the 30 year bond (ZB) and The YM futures contract. The YM contract is the DJIA and the purpose is to show reverse correlation between the two instruments. Remember it's liken to a seesaw, when up goes up the other should go down and vice versa.
Yesterday the ZB made a major move at around 8:45 AM EST. The ZB hit a High at around that time and the YM hit a Low. If you look at the charts below ZB gave a signal at around 8:45 AM EST and the YM was moving Higher at the same time. Look at the charts below and you'll see a pattern for both assets. ZB hit a High at around 8:45 AM and the YM was moving Higher at the same time. These charts represent the newest version of MultiCharts and I've changed the timeframe to a 15 minute chart to display better. This represented a Shorting opportunity on the 30 year bond, as a trader you could have netted about 15 ticks per contract on this trade. Each tick is worth $31.25. Please note: the front month for the ZB contract is now June, 2019 and I've changed the format to Renko bars such that it may be more apparent and visible.
Charts Courtesy of MultiCharts built on an AMP platform
Bias
Yesterday we gave the markets a Neutral bias as the markets didn't appear to have any sense of direction. The Dow dropped 84 points and the other indices dropped as well. Today we aren't dealing with a correlated market and our bias is Neutral.
Could this change? Of Course. Remember anything can happen in a volatile market.
Commentary
Yesterday morning it appeared that the markets had no direction because the USD and the Bonds were both pointed lower however the indices were lower as well and this didn't change as the morning wore on, hence the Neutral bias which means the markets could go in any direction and often does. Does this mean a change in overall direction in terms of trend? No. We still believe the market wants parity as to where it was prior to the Trade War erupting. We believe that the markets will continue its but it will be a slow climb unless a deal is announced. Why do we feel that way? We're not seeing the markets drop by a thousand points at a clip. If that were the case we'd have a different opinion.
Author

Nick Mastrandrea
Market Tea Leaves


