The average is the most informative and least informative measure of them all

S2N spotlight
Your financial advisor, stockbroker, hairdresser, builder, physio, and granny will tell you that the stock market only goes up over time. They are all correct, except my physio, who says they not only go up over time but also never go down.
If you look at this chart, you will see the mantra ‘No Risk, No Reward’ in full swing. Since 1980 (46 years), the average annual return has been 12% with an intra-year drawdown of -14%.
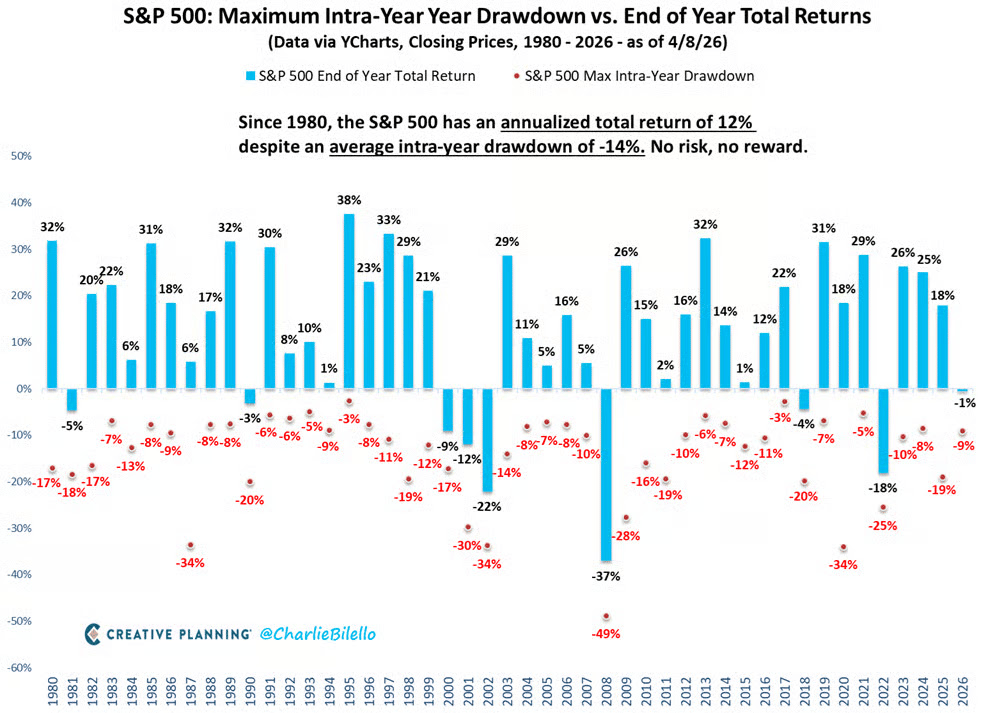
The point my provocative title is trying to make is that the average of a 46-year statistic only informs your action when you apply a similar long-term view. Focusing on the average ignores the journey. The journey is what makes capturing the average so difficult.
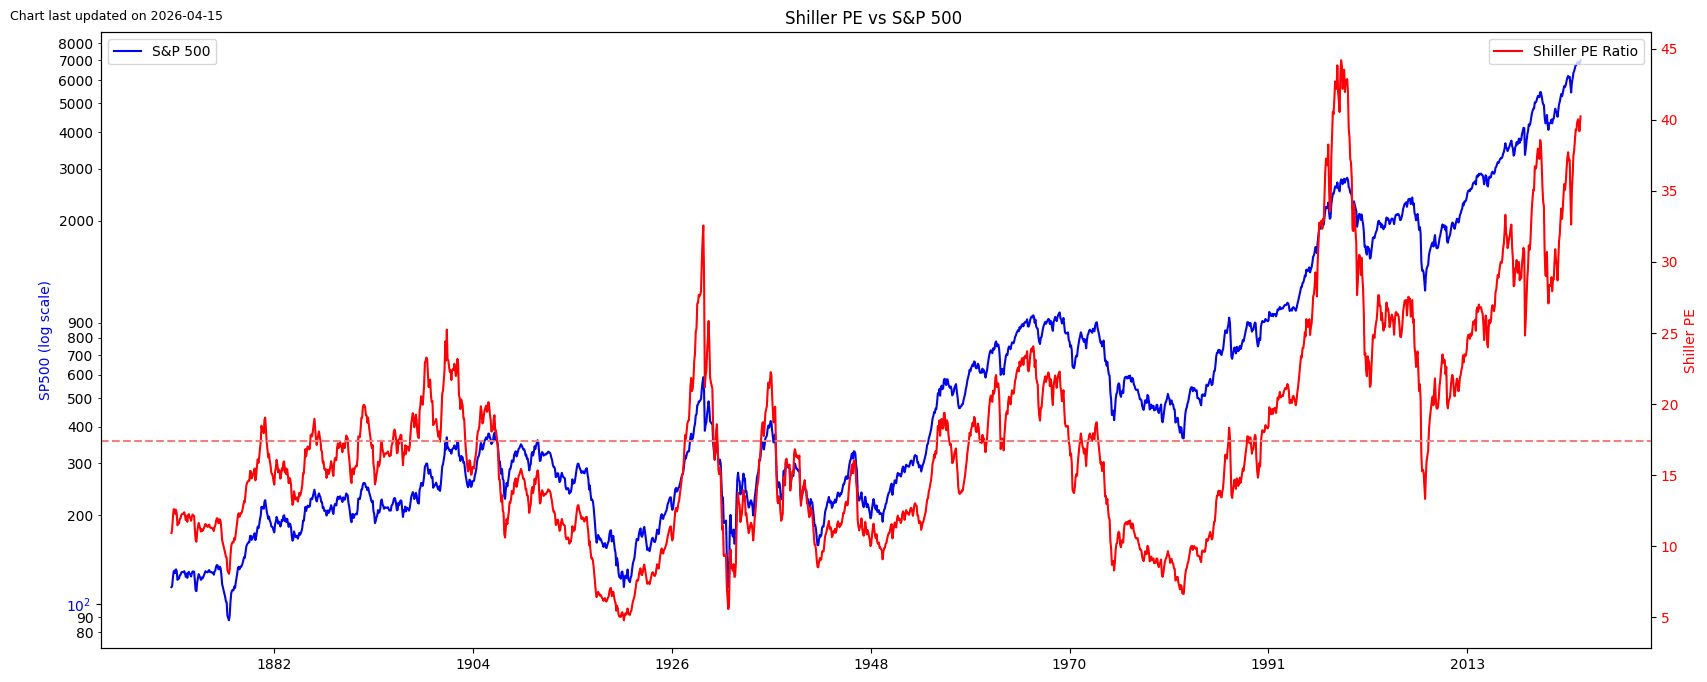
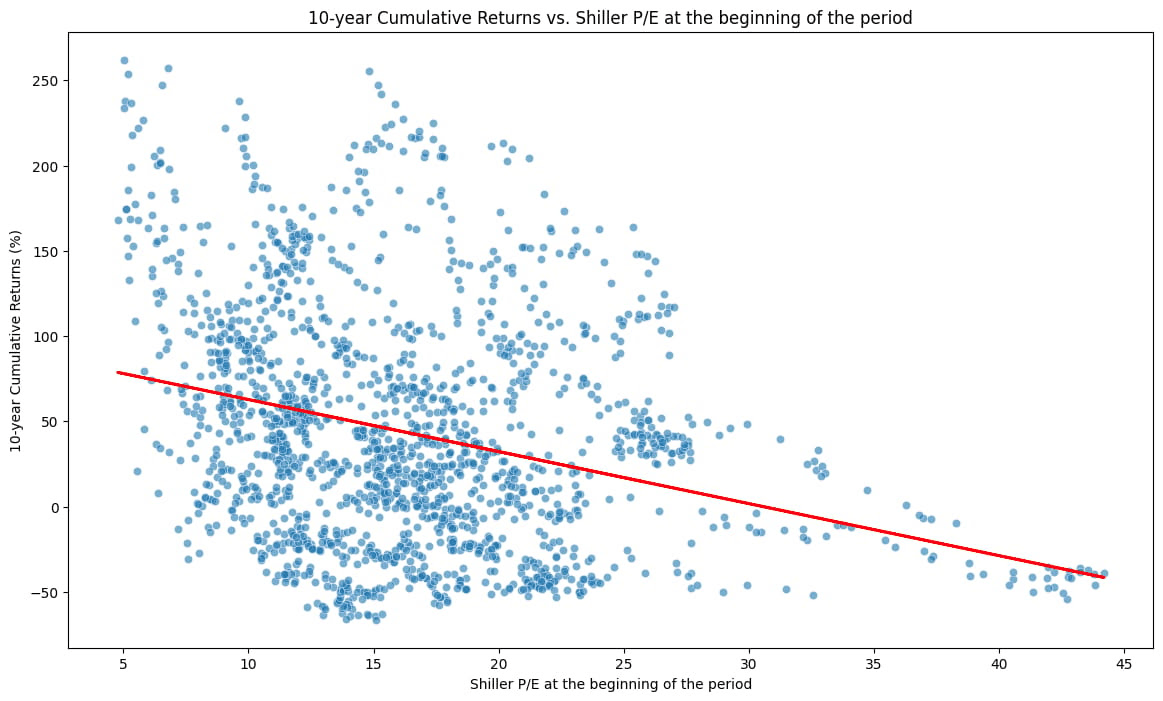
However, we don’t live in a completely random world. There are business cycles that have an influence on these averages. The model I find to be the most powerful and logical is the Shiller PE valuation model, which looks at the smoothed 10-year average of earnings.
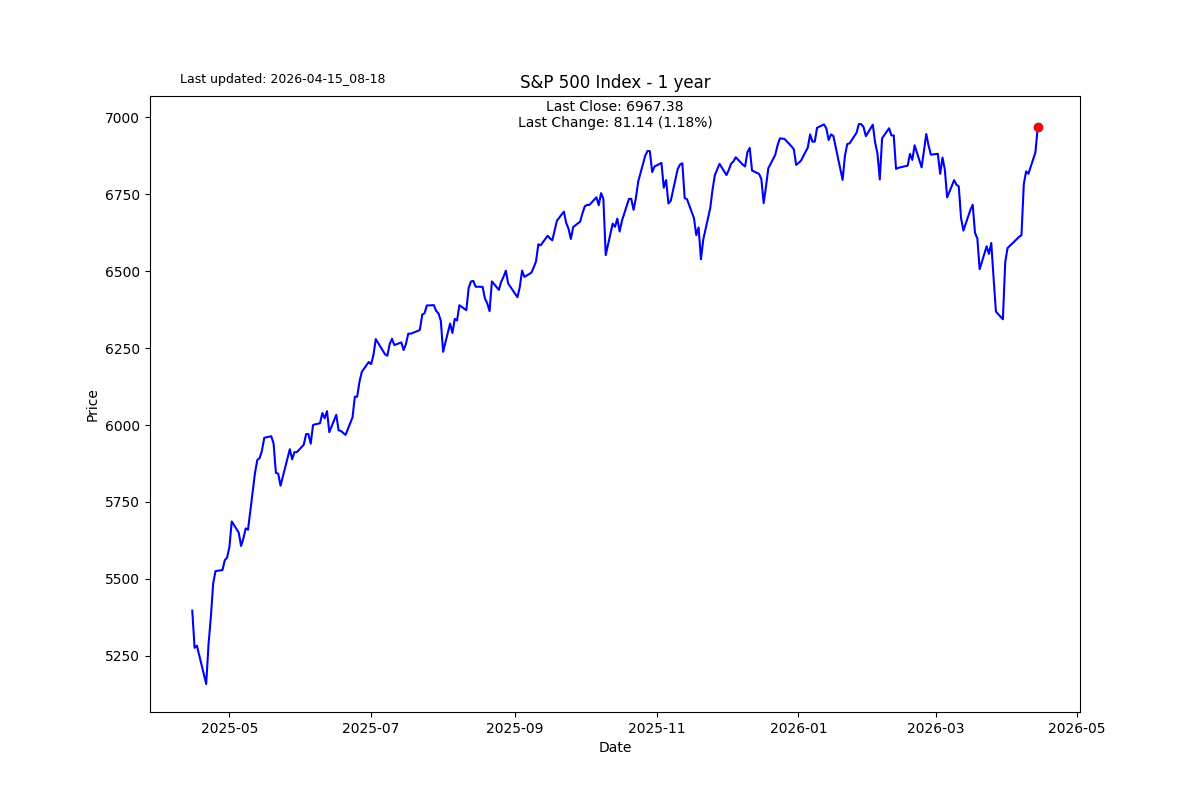
Except for the dot-com boom in 2000, the Shiller PE ratio has never been higher. The S&P 500 is back at all-time highs, and the Shiller PE is at 40. What is next?
There comes a time when too much of a good thing starts to work against you. The more beer you drink, the greater the probability you will need to go to the bathroom to make a wee. If you need to make a wee now, then the probability you will need to wee in one hour is even greater, and the probability you will need to wee in 10 hours is even greater.
In the next few charts the probability of making that proverbial wee clearly increases.
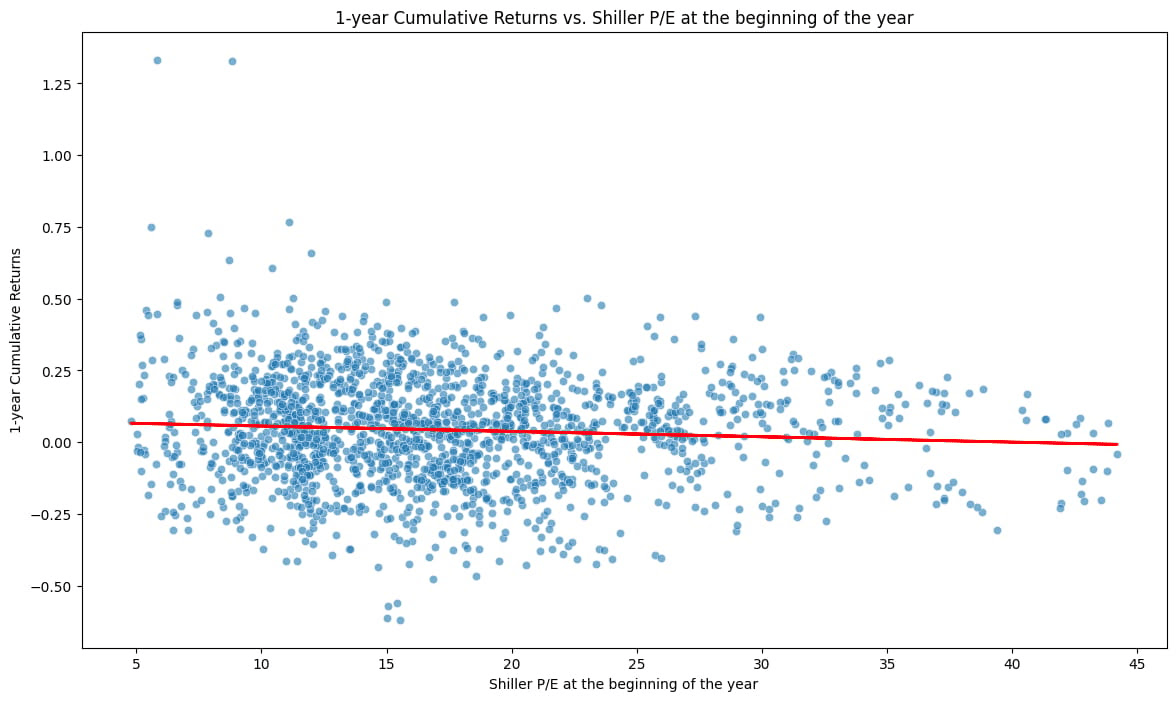
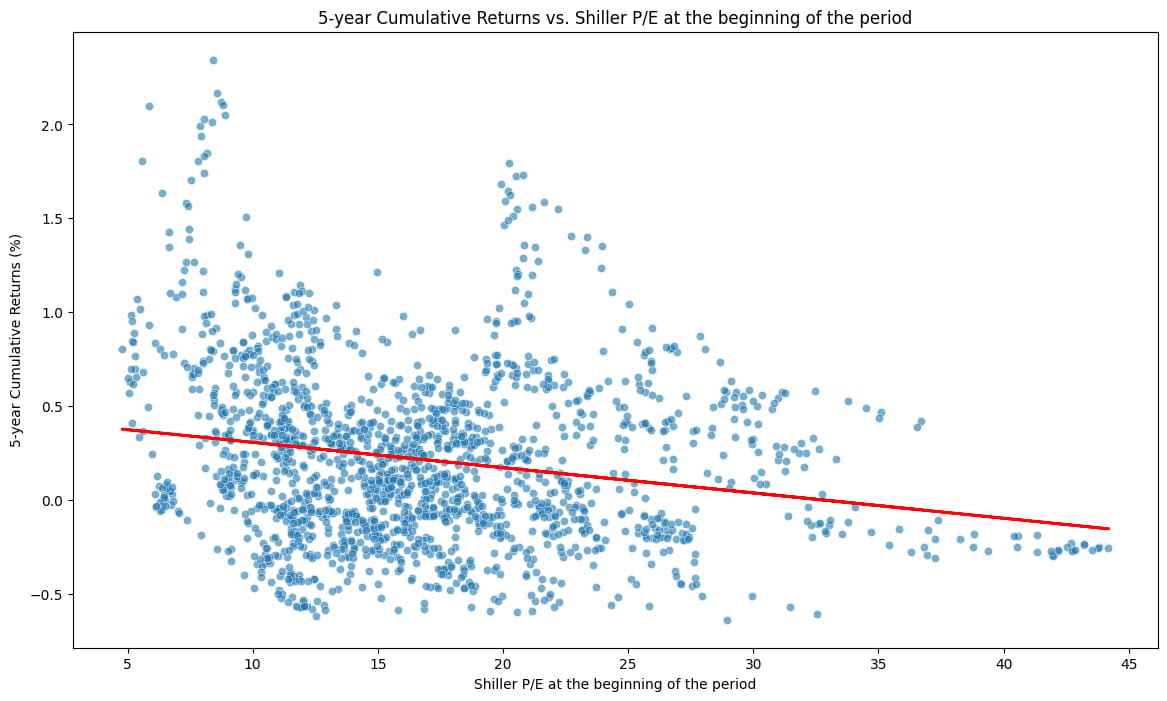
The probability of a negative return over 10 years in the S&P 500 index increases dramatically as the Shiller PE ratio goes up. This regression is not iffy. This line is making a statement, like Lady Gaga at the Met Gala.
S2N observations

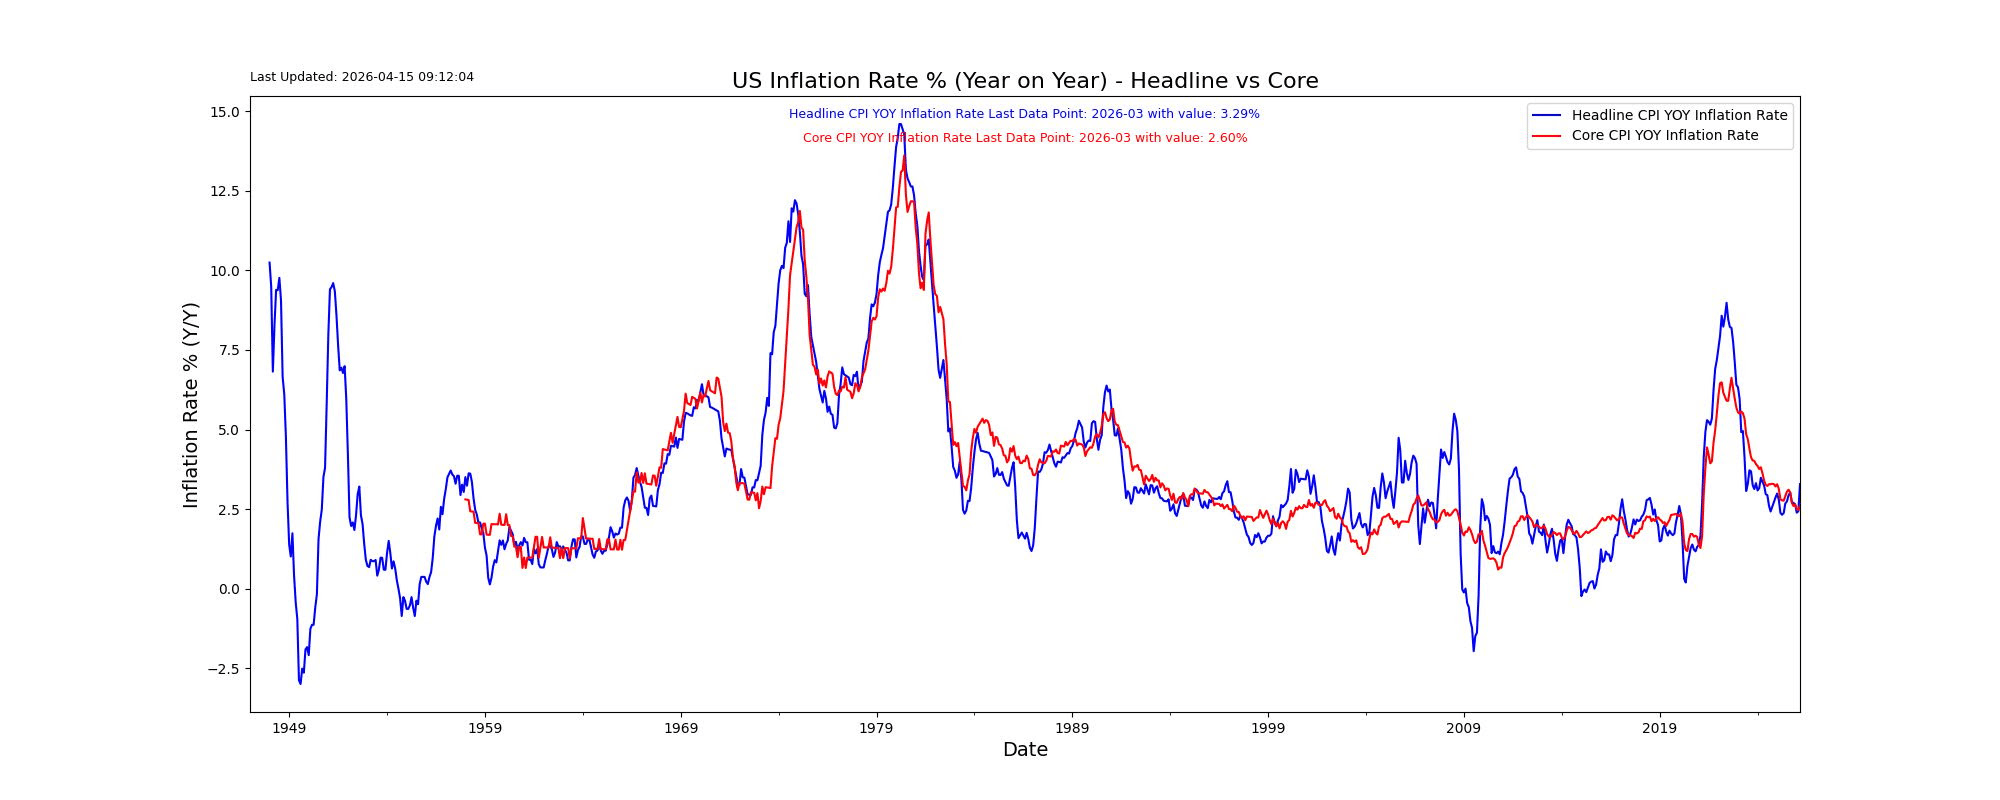
I have to say that the big market expectations driver continues to be. The market is completely uninterested in the underlying economics of the day. The fact that headline inflation is now up 3% year on year is discounted like a nothing burger.
We haven’t really even seen the pass-through of the oil crisis in these numbers. The March numbers barely reflect any increase in pricing.
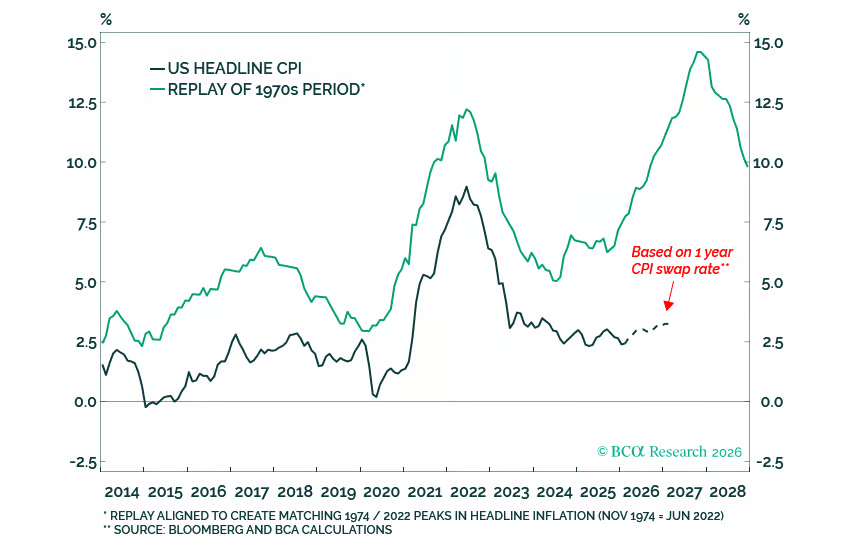
We were firmly on an upward inflation trajectory before the war on Iran. This analogue below gives one an interesting perspective on how things could play out. Those in the know say this crisis is bigger than the 1970s.
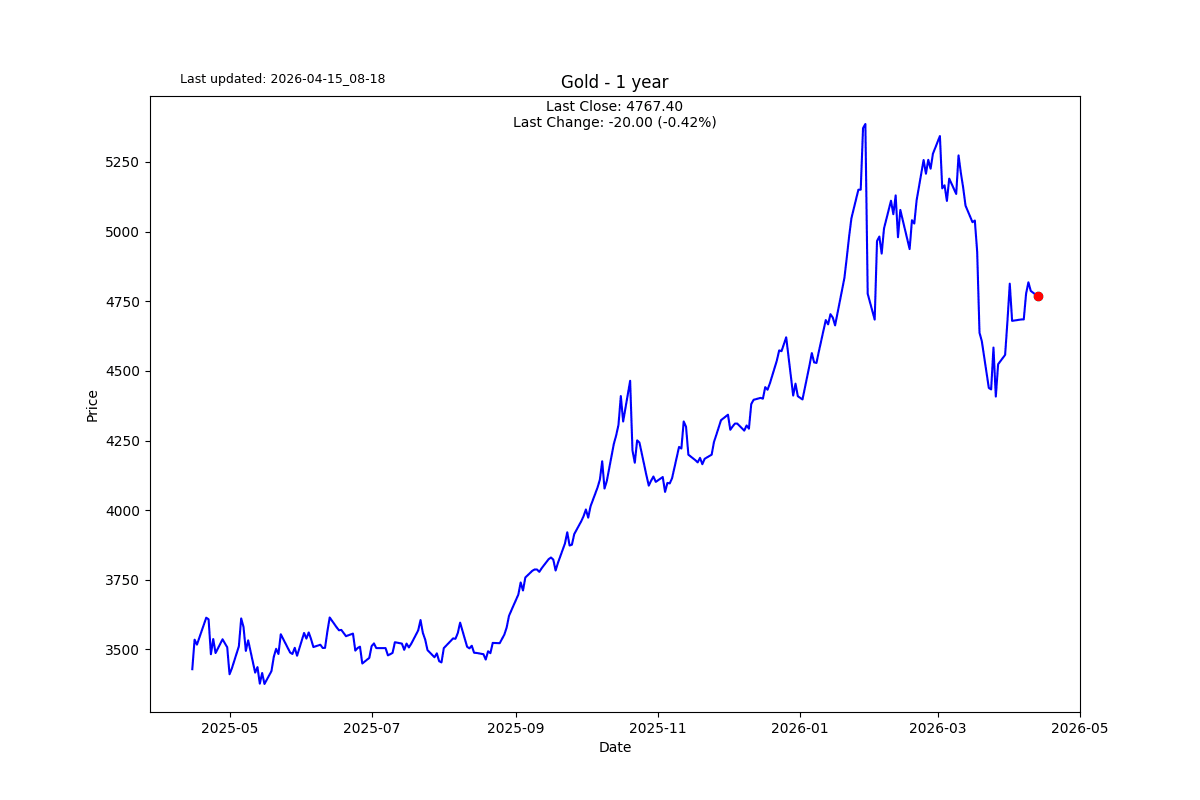
I have to say that I think gold is going to be the most sensible place to ride out the coming inflation storm. There is no chance the Fed and Treasury will behave responsibly in the coming economic slowdown that everyone can see unfolding. It is no longer coming; it is here. Every news channel, every dinner table conversation I listen to, I hear about the cost of living crisis. It is not fearmongering; it is reality.
I don’t think Trump’s first choice Kevin Warsh will jump on inflation if and when he runs the Fed. Despite his history of hawkishness. He has a net worth of close to $200 million tied heavily into startups in the valley, and his wife’s $1.5 billion inheritance from Estée Lauder might play into an accommodative stance. That is noise, not signal, but I just felt the need to get it off my chest.
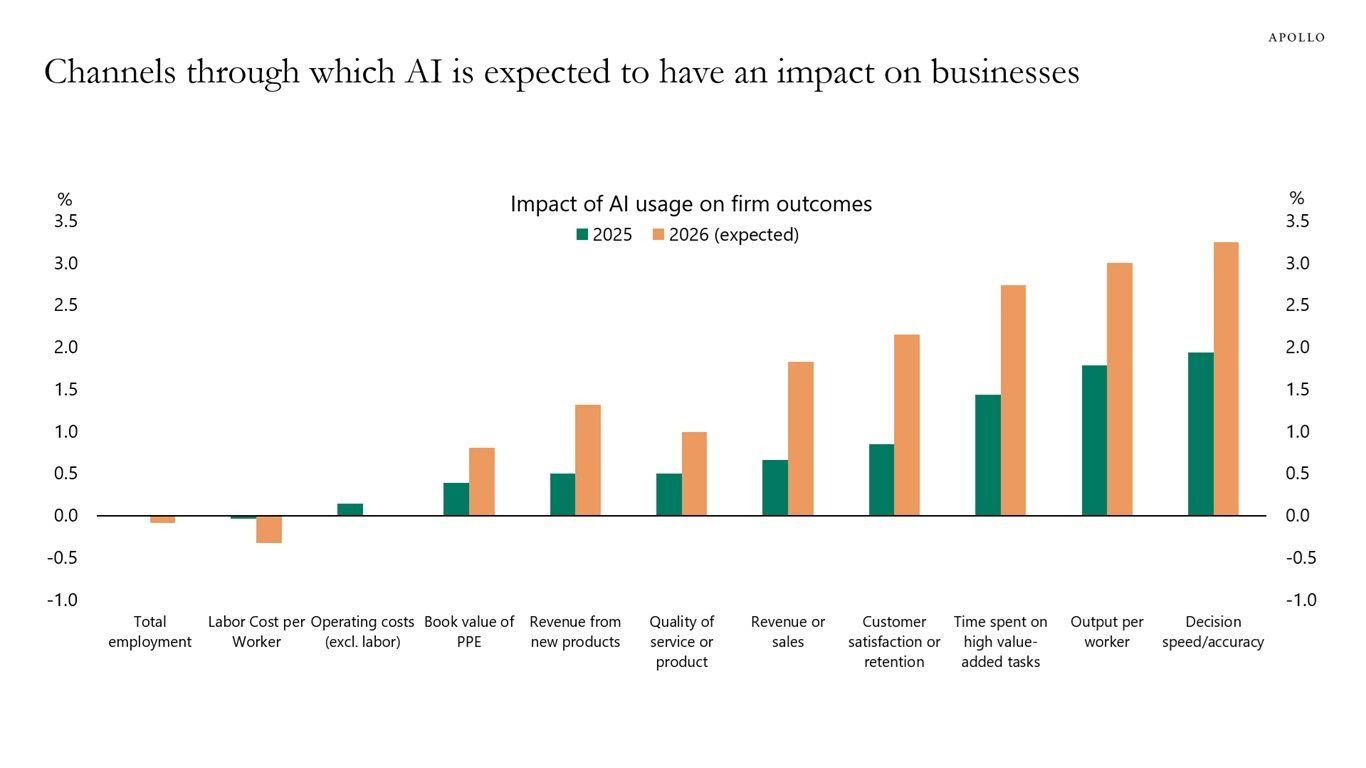
McKinsey just released a major note on their clients’ AI use. 88% of companies now use AI in at least one business function. Only about 6% are what McKinsey calls “high performers", getting 5% or more EBIT impact from AI.
McKinsey found only about 21% of companies have fundamentally redesigned any workflow when deploying AI. Four out of five bolted AI onto processes designed when humans did all the work by hand.
I read a great post today by Reuven Gorscht on how many CEOs are simply going through the motions with trying to adopt AI into their businesses. Everyone is saying that you need to be implementing this into your business.
The problem is that most are simply asking staff to use it and improve their processes. That is simply not going to cut in this new AI world. That approach will quickly reach a ceiling in terms of productivity enhancement.
The winners in this space are going to be the CEOs who completely rewrite the way departments run. There will be job cuts, new positions created and dramatic shifts in productivity. Instead of back office writing better internal memos and emails to clients.
I am still amazed at how that first bucket is showing almost no job losses. That is not how I see the disruption playing out in the near term. I personally think the recession that has been kicked down the road so many times over the last decade is going to finally appear, and it will be brutal. It will force the slow adopters of AI to pick up their pace of adoption and repurpose the way many departments are being run.
That is not to say that there won’t be prosperity at the end of the washout. I foresee a period with the potential for tremendous prosperity but there needs to be some bitter medicine taken before we get to that point.
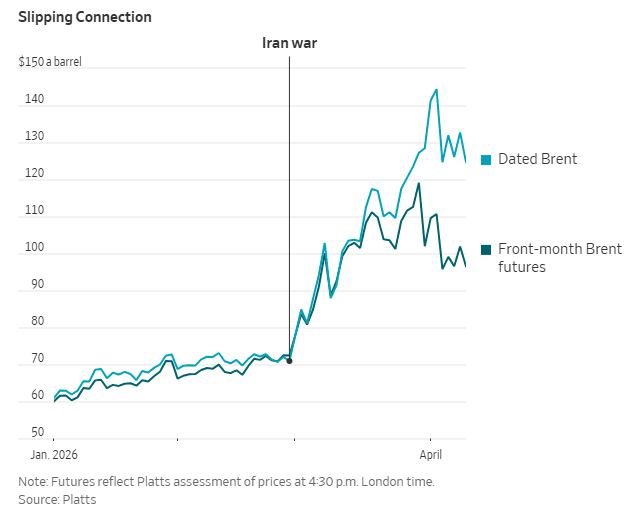
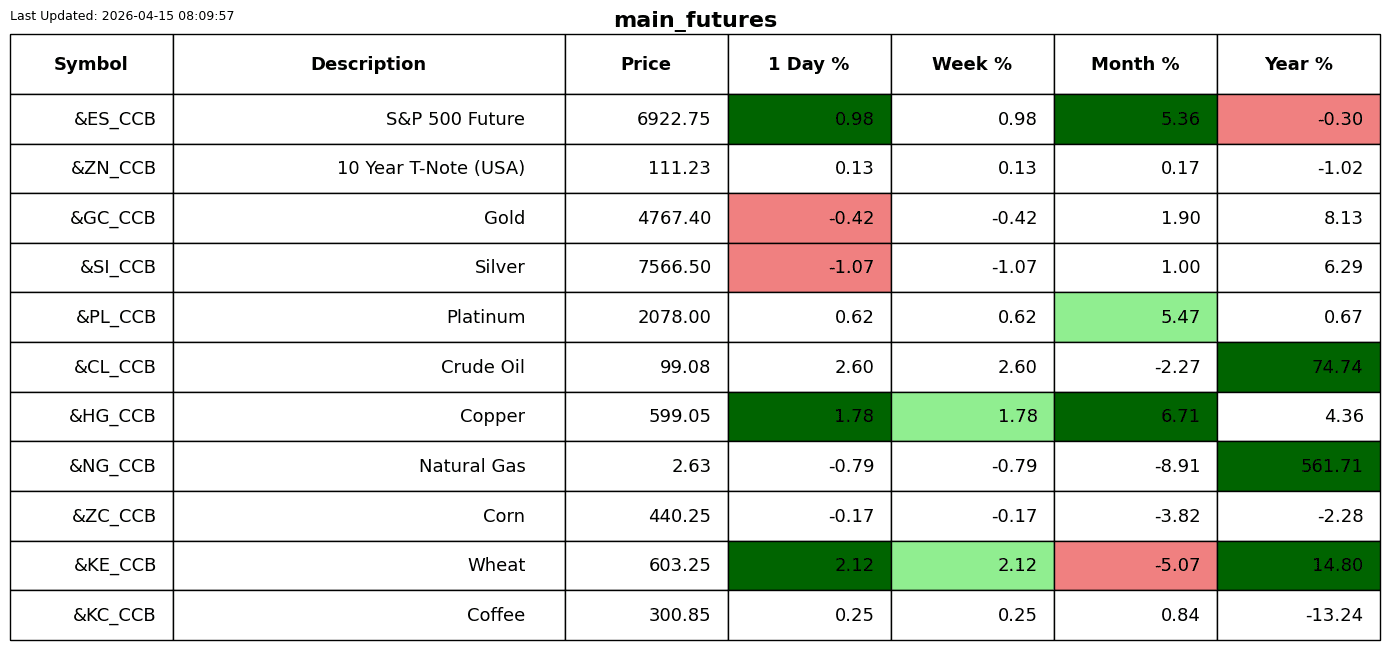
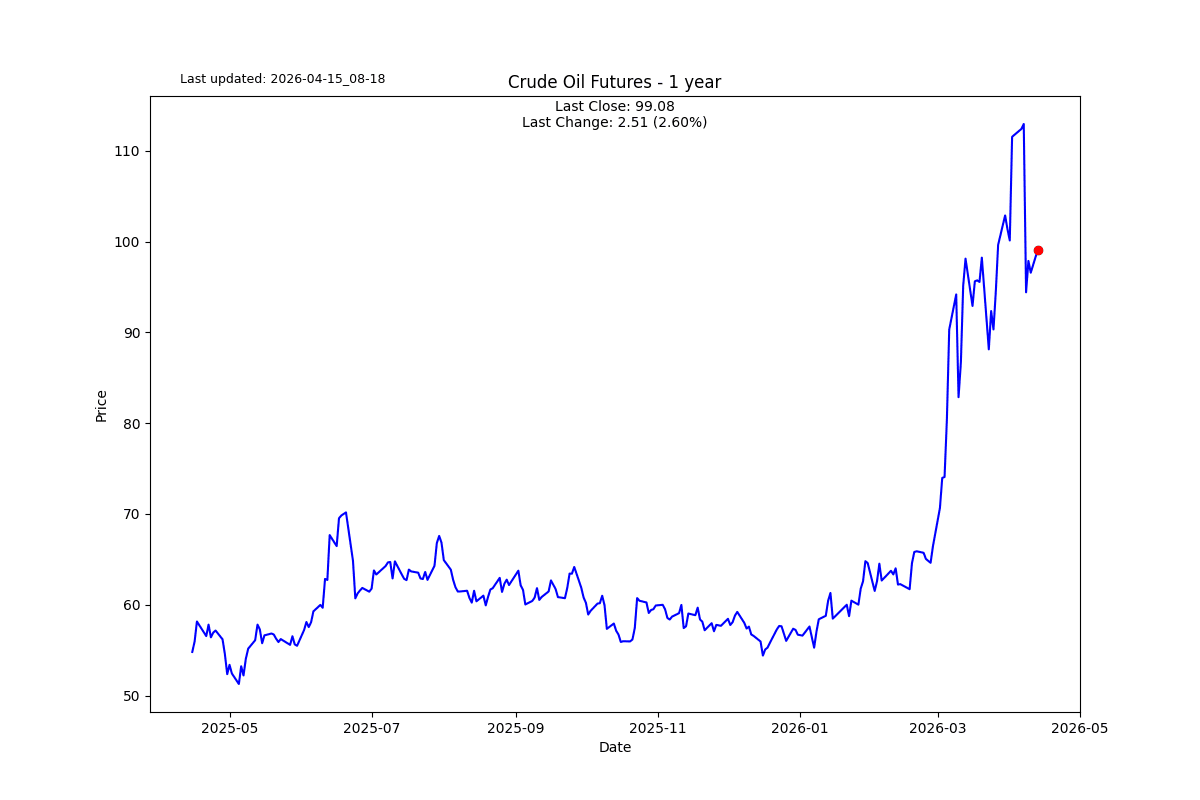
Never in history has there been such a divergence in the physical price for oil and the futures traded price, something like $30. There is more going on behind the scenes here than a greek wedding.
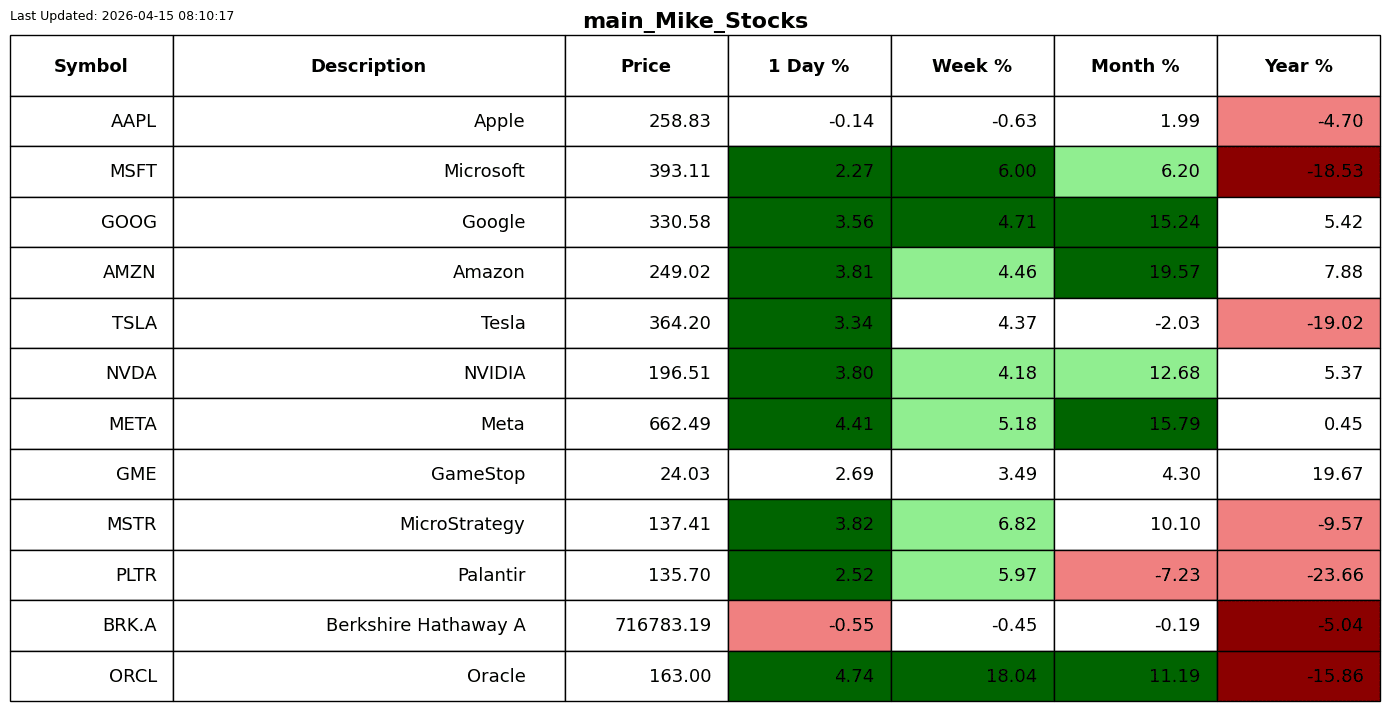
S2N screener alert
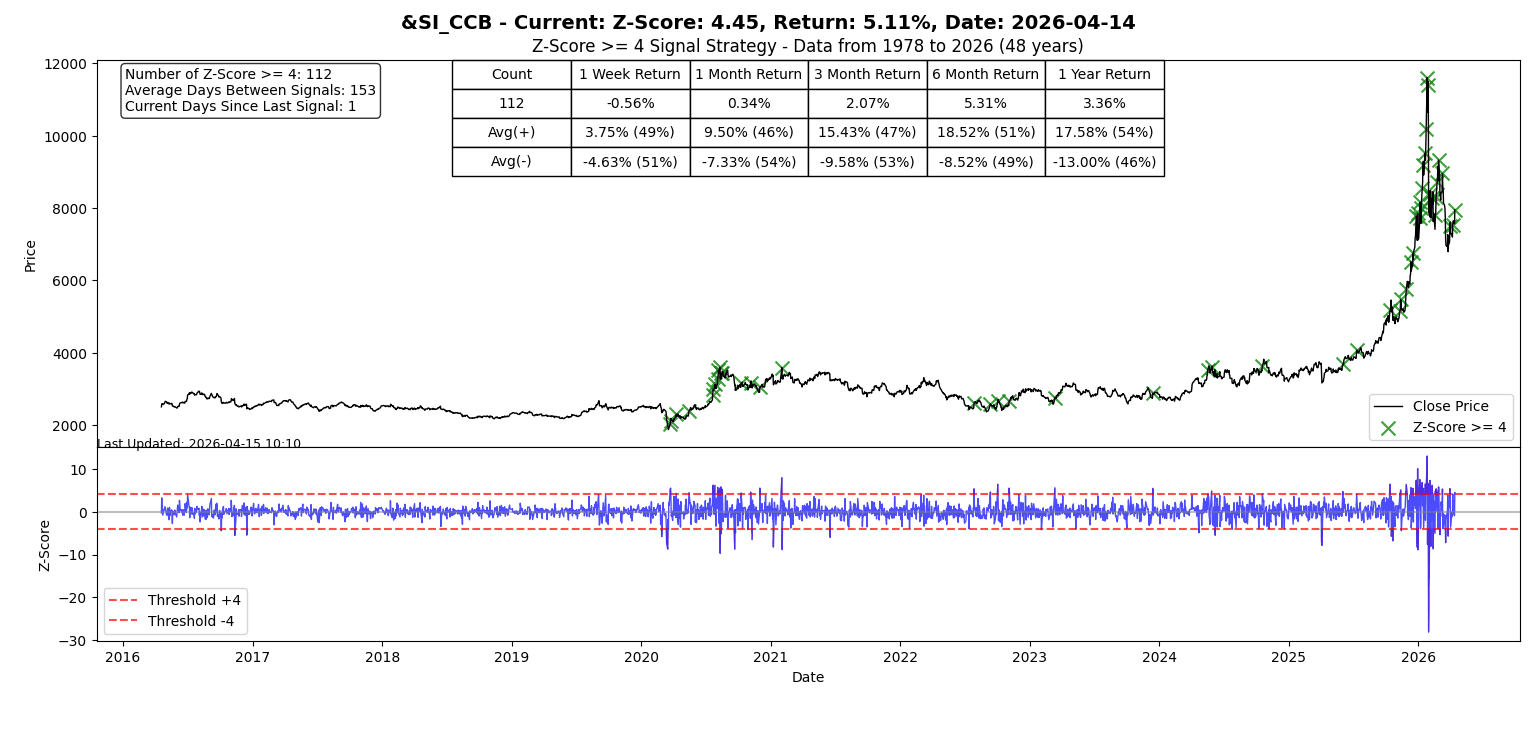
The Lone Ranger got out his whip and said ‘Hi Yo Silver.’ Yesterday was a Z-score of 4 on the upside; I've only seen 112 of those in 48 years.
S2N performance review
S2N chart gallery
Author

Michael Berman, PhD
Signal2Noise (S2N) News
Michael has decades of experience as a professional trader, hedge fund manager and incubator of emerging traders.


