The AUD/USD between the RBA and the US election

After reaching its lowest level since August 2024 last week at around 0.65362, the AUD/USD is bouncing back to trade at around 0.6623 according to ActivTrades’ Forex data at the time of writing. However, it remains vulnerable to further downside risks if the US Dollar strengthens.
Earlier today, the Reserve Bank of Australia (RBA) maintained its interest rates unchanged at 4.35%. This decision contrasts with the potential for further rate cuts by other major central banks, such as the Federal Reserve. Americans are also heading to the polls to elect their next American president, not to mention that the Senate and House are also at stake. On Thursday, the Fed will share its latest monetary policy decision, which is also likely to affect the currency pair.
Given the current market dynamics, what can traders expect for the AUD/USD pair? Which key price levels should they monitor? And what upcoming events could significantly impact this currency pair? Let's delve deeper into these questions.
RBA maintains Hawkish stance, rates on hold
The Reserve Bank of Australia (RBA) left its official interest rates unchanged today, marking a full year without a significant shift in policy while still keeping the door open for a potential rate increase if inflation pressures resurface. This cautious stance reflects the RBA’s ongoing commitment to managing inflation, which remains a primary concern even as the central bank refrains from tightening policy further.
In its latest statement, the RBA noted that while inflation has recently eased, it will still "be some time yet before inflation is sustainably in the (2% to 3%) target range and approaching the midpoint." This reflects the RBA's vigilance regarding "upside risks to inflation," highlighting that, while progress has been made, further actions could be necessary if inflation pressures persist.
Recent trends in the Australian inflation
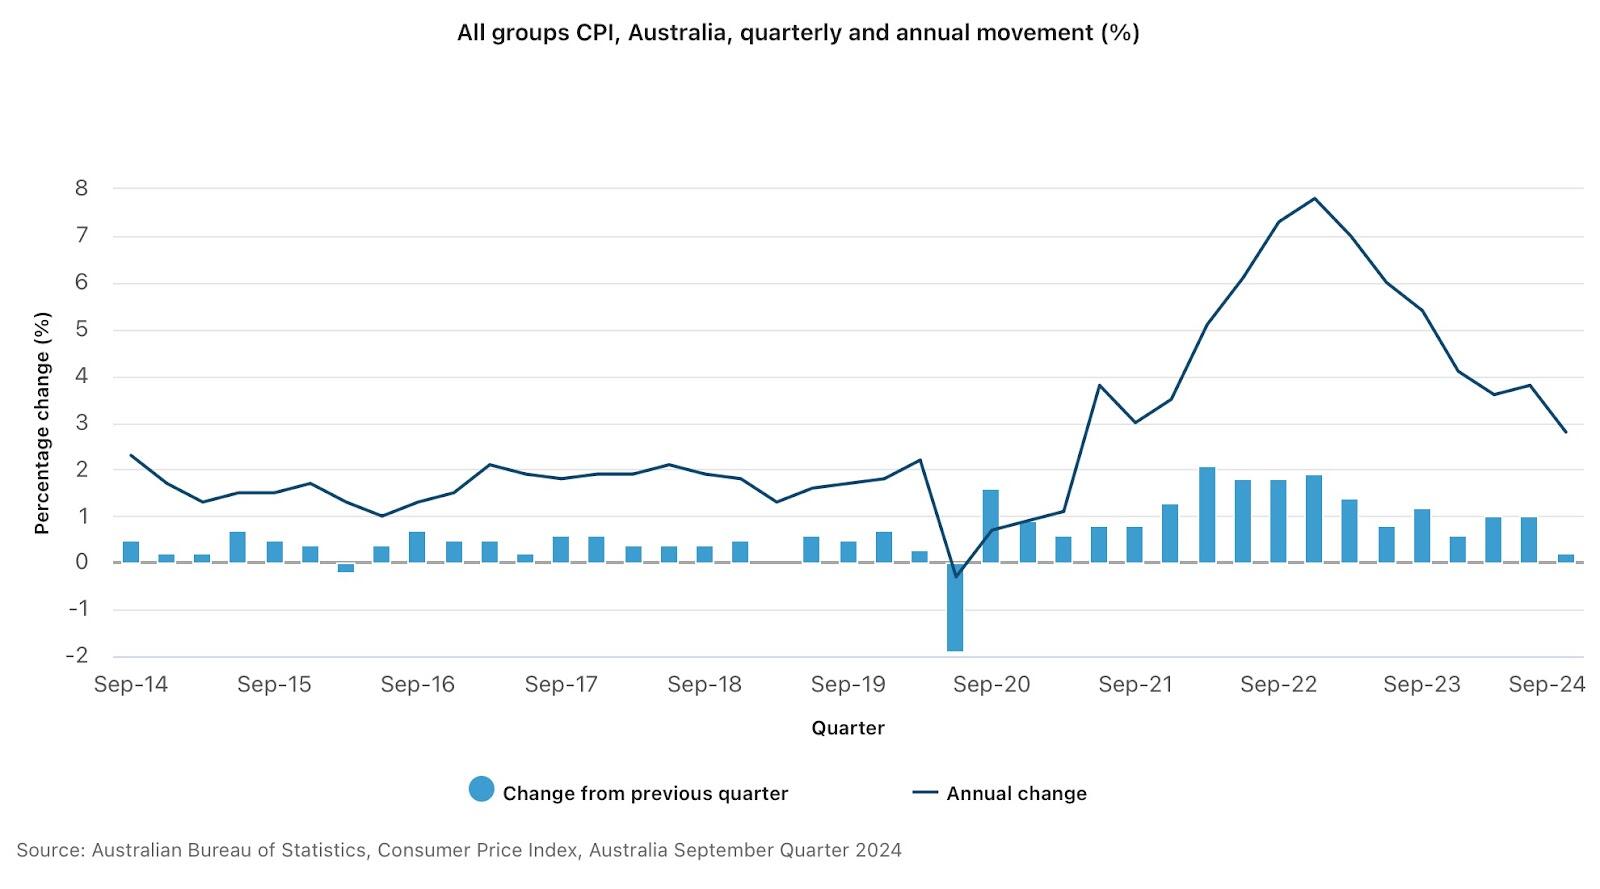
For the first time since mid-2021, Australia’s inflation rate has dropped back within the RBA’s target range of 2% to 3%. According to the Australian Bureau of Statistics, annual inflation for the September quarter stood at 2.8%, a significant decline from 3.8% in the previous quarter. However, this drop was largely due to temporary factors, such as federal government rebates designed to mitigate the impact of rising power prices on households.
While headline inflation appears to be moderating, core inflation—often viewed as a more accurate measure of underlying price pressures—remains stubbornly high. Core inflation rose by 3.5% over the past year, down from 4.0% in the previous quarter but still above the RBA's target. Additionally, annual services inflation rose slightly to 4.6% in the third quarter from 4.5% in the prior period, indicating persistent inflationary pressures in the service sector, which tends to be more sensitive to labour and wage dynamics.
Manufacturing activity in Australia
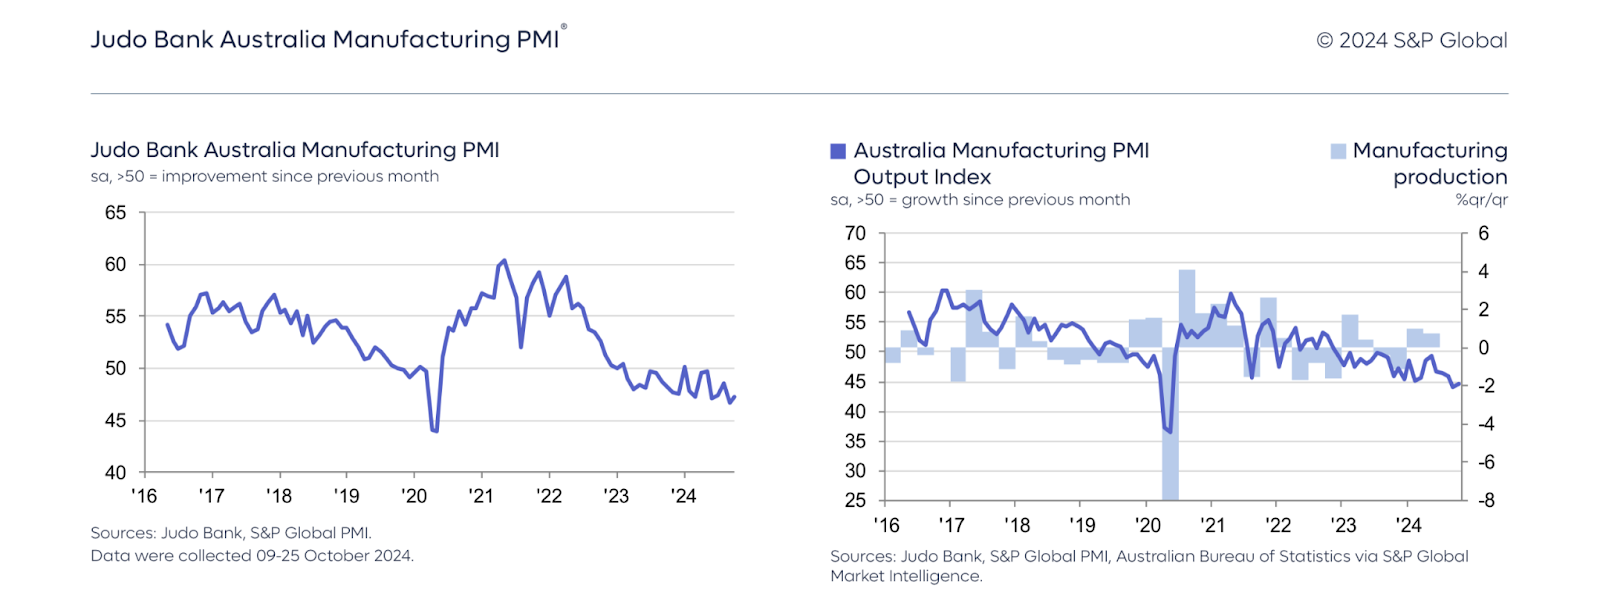
In terms of economic activity, the Australian manufacturing sector has shown modest improvement, but overall it remains weak. The Judo Bank Australia Manufacturing PMI, which measures manufacturing activity, registered at 47.3 in October, up slightly from 46.7 in September. This reading still indicates contraction, marking the ninth consecutive month of declining manufacturing conditions. Although there was a slight uptick, the index remains below 50, reflecting the sector’s ongoing struggles in an environment of high costs and cautious consumer spending.
The RBA vs other Central Banks and what does the market expect?
The RBA's cautious approach contrasts with more aggressive stances taken by other major central banks, such as the European Central Bank (ECB) or the Federal Reserve (Fed), which have started lowering their key rates and are considering further monetary tightening.
Part of the RBA’s restrained approach is due to its delayed start in raising rates and its “relatively modest” peak rate of 4.35%, as policymakers prioritised limiting job losses over rapid tightening. This divergence in monetary policy has influenced the Australian dollar (AUD), which could face further downward pressure if this policy gap continues to widen.
Money market traders currently anticipate that the RBA may not adjust its rate policy until at least May, as persistently high core inflation supports this outlook. If core inflation remains resilient, the RBA may even need to consider further tightening to control price pressures, although this remains uncertain given evolving economic conditions.
The AUD/USD outlook
The AUD/USD currency pair reached a peak in late September 2024 at approximately 0.6942—its highest level since February 2023—before entering a downward trend. This recent decline saw the pair lose over 5.1% through September and October, bringing it down from recent highs as selling pressure dominated.
As of today, the pair has shown early signs of recovery, with its price moving above the blue line of the Ichimoku indicator, suggesting an attempt to regain upward momentum. The Relative Strength Index (RSI) also points upward, indicating some buying interest, although it remains below the neutral 50 level. For a confirmed bullish signal, the RSI would need to rise above this neutral threshold, which would reinforce buyers’ control in the short term.
Additionally, the Directional Movement Index (DMI) shows a potential convergence between the DMI+ and DMI- lines. Should the DMI- line cross above the DMI+ line, it would signal a possible bullish shift for the AUD/USD, highlighting a potential trend reversal and stronger upward movement for the AUD/USD pair.
For a sustainable upward trend, the pair would, however, need to advance past further resistance levels, specifically the red line of the Ichimoku indicator, and ideally break through the Ichimoku cloud. Such a move would signal a stronger bullish bias, potentially enabling the pair to test previous resistance points around 0.6656 and 0.6749. As we explained, a bullish RSI above 50 would add confirmation to this scenario, strengthening the case for an extended recovery.
Conversely, if the pair resumes its decline, it may target former support levels at approximately 0.6346 and 0.6399. A break below these levels could indicate a continuation of the bearish trend, suggesting that selling pressure remains strong.
Given the current technical setup, traders should closely monitor the RSI and DMI indicators for signs of further bullish momentum or renewed selling pressure. A decisive move above the Ichimoku cloud could mark a bullish reversal and provide trading opportunities towards higher resistance levels. However, if the AUD/USD fails to sustain its upward push, it may test key support zones, keeping the broader trend bearish.
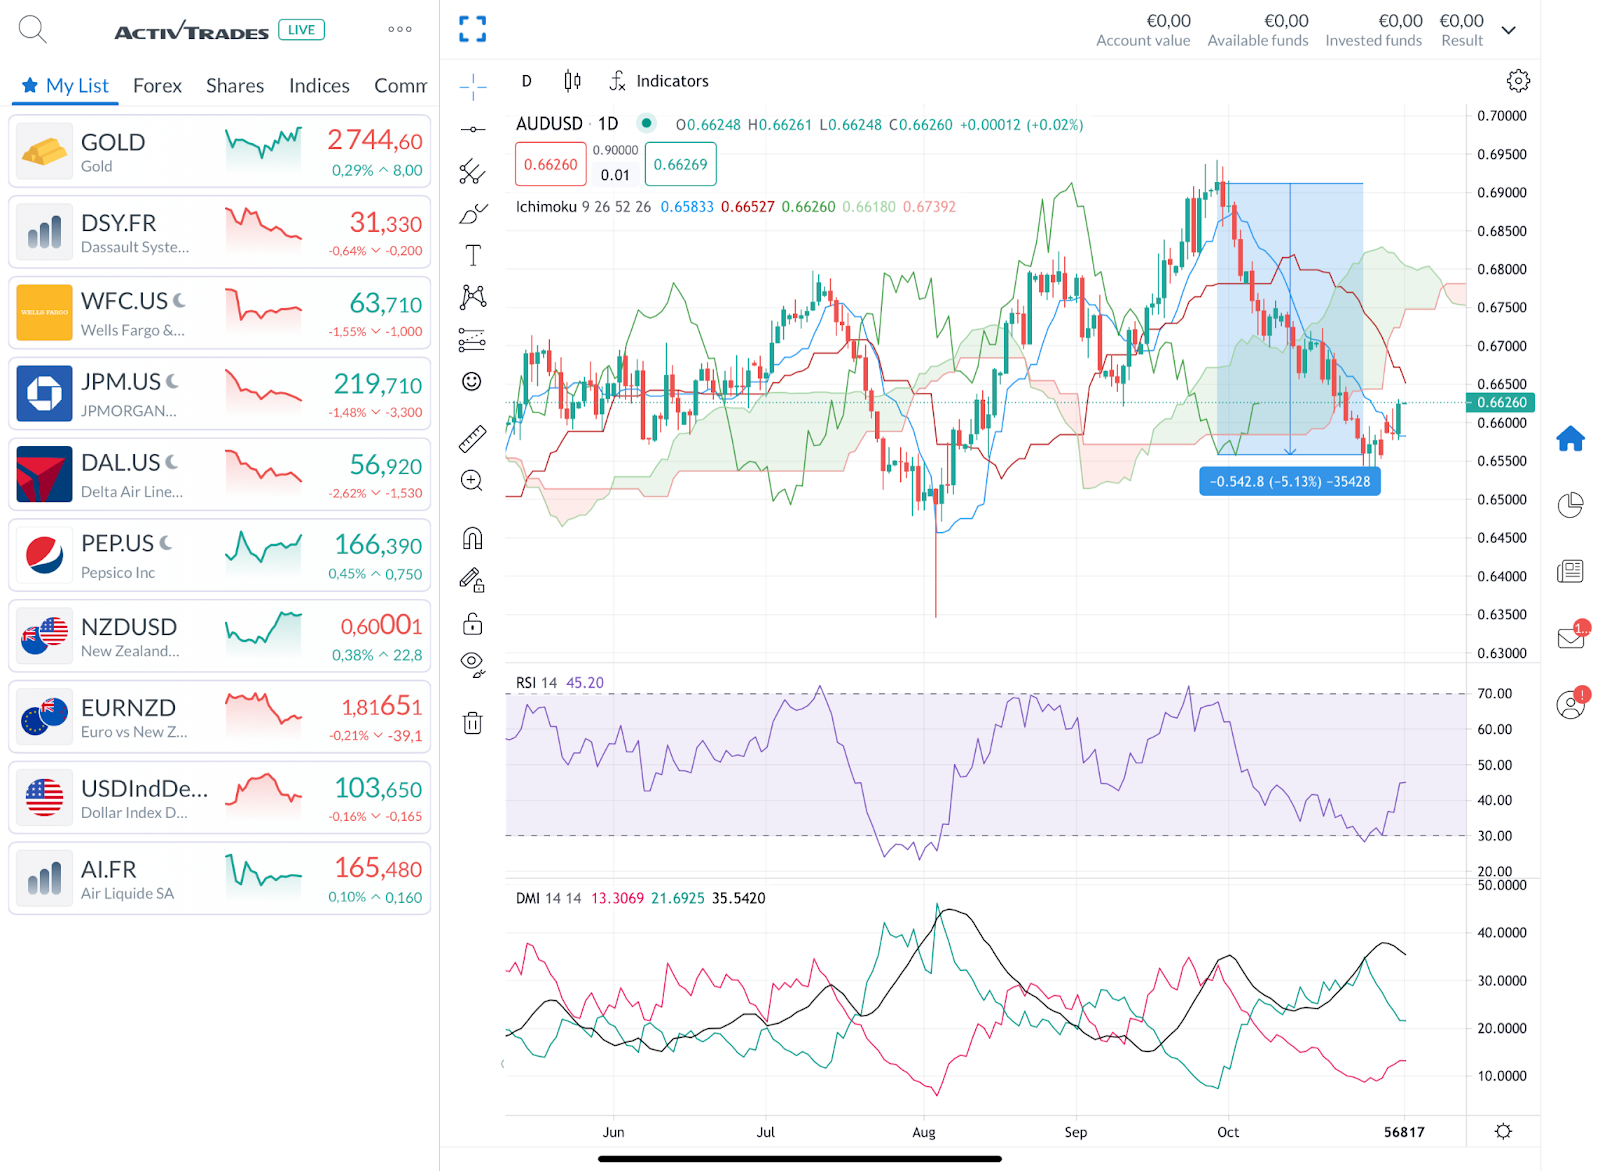
AUD/USD Daily Chart - Source: ActivTrader
The information provided does not constitute investment research. The material has not been prepared in accordance with the legal requirements designed to promote the independence of investment research and as such is to be considered to be a marketing communication.
All information has been prepared by ActivTrades (“AT”). The information does not contain a record of AT’s prices, or an offer of or solicitation for a transaction in any financial instrument. No representation or warranty is given as to the accuracy or completeness of this information.
Any material provided does not have regard to the specific investment objective and financial situation of any person who may receive it. Past performance is not a reliable indicator of future performance. AT provides an execution-only service. Consequently, any person acting on the information provided does so at their own risk.
Stay up to date with what's moving and shaking on the world's markets and never miss another important headline again! Check ActivTrades daily news and analyses here.
Author

Carolane de Palmas
ActivTrades
Carolane graduated with a Masters in Corporate Finance & Financial Markets and got the AMF Certification (Financial Markets Regulator in France). Afterward, she became an independent trader, investing mostly in European and American stocks/indices.


