|

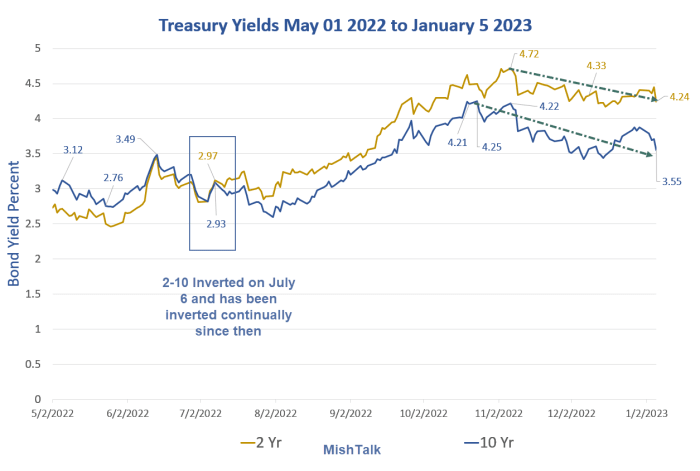
The 2-10 treasury yield spread note has been inverted since July 6, 2022

Let's explore continual inversions on the 2-year to 10-year and 3-month to 10-year treasuries.

3-Month to 30-Year

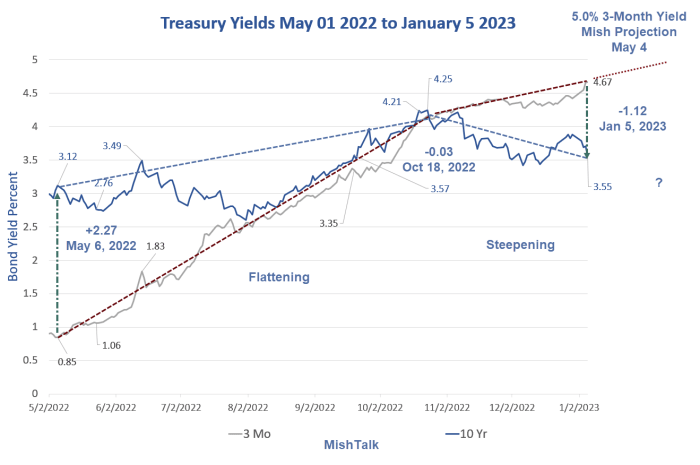
The 3-month to 30-year inverted on October 18, 2022 and has been inverted ever since.

Treasury Yield Spreads May 01 2022 to January 5 2023

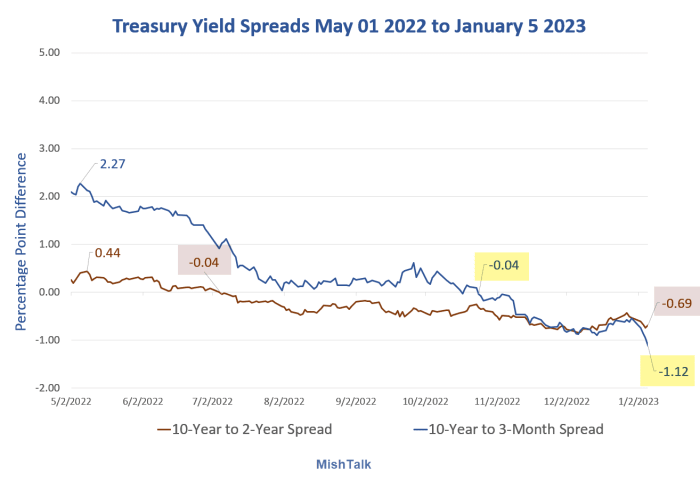
The 2-year to 10-year inversion is one of the most widely followed recession indicators. It has been inverted continually since July 6, 2022.

The 3-month to 10-year inversion is even more extreme. It has been continually inverted since October 18, 2022. 

Terrible Economic Data

The December jobs report was anemic and the ISM services PMI was an outright disaster.

  • December Jobs: Employment Rises by 717,000 All of Them Part Time
  • ISM Services Plunges 6.9 Points Into Contraction, Another Recession Warning
  • Stock Market Cheers Weak Job Report, But Big Picture Still Looks Grim
 

Although housing in the gutter and the rest of the economy sinking fast, the Fed is committed to a course of action to maintain credibility.

To steepen in the traditional sense first requires the curve to flatten. With the Fed holding rates higher for longer, that won't easily happen unless the Fed panics due to a credit event.

Given that the Fed has repeatedly vowed to keep rates higher for longer regardless of economic slowing, do not expect the curve to steepen other than by deeper inversions until recession hits. 

For more discussion on this idea please see Hello Curve Watchers, the Yield Curve is Steepening, Just Not in the Normal Sense

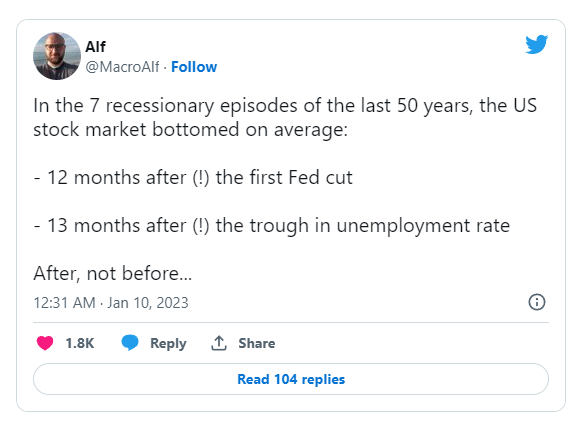
Here is a key idea regarding the stock market:

fxsoriginal

Author

Mike “Mish” Shedlock's

Mike “Mish” Shedlock's

Sitka Pacific Capital Management,Llc

More from Mike “Mish” Shedlock's
Share:

Editor's Picks

EUR/USD consolidates around 1.0900, bullish bias remains ahead of key US data

The EUR/USD pair is seen consolidating its strong gains registered over the past two days and oscillating in a narrow band during the Asian session on Tuesday. Spot prices currently trade around the 1.1900 mark, just below an over one-week high touched the previous day.

GBP/USD tilts bullish as markets barrel toward mid-week NFP print

GBP/USD is holding a broader bullish structure on the daily chart, with price trading well above the 50 Exponential Moving Average at 1.3507 and the 200 EMA at 1.3310, confirming the intermediate uptrend that has been in place since the November 2025 low near 1.2300. 

Gold: Will US Retail Sales data propel it above $5,100?

Gold hovers below weekly highs of $5,087 early Tuesday, await US Retail Sales data. The US Dollar enters a downside consolidation phase amid persistent Japanese Yen strength and worsening labor market. Gold settled Monday above $5,000, now looks to take out $5,100 amid bullish daily RSI.

Top Crypto Gainers: World Liberty Financial, MemeCore and Quant gain momentum

World Liberty Financial, MemeCore, and Quant are leading gains over the last 24 hours as the broader cryptocurrency market stabilizes after last week’s correction. Still, the technical outlook for altcoins remains mixed due to prevailing downside pressure and vulnerable market sentiment. 

The market is buying everything again but is it dancing on a borrowed floor

The market has a short memory and a fast trigger finger. Last week’s liquidation barely cooled before risk came roaring back, pushing the S&P toward record territory and reinstalling Big Tech as the engine of choice. This is not discovery. It is re exposure.

Ripple exposed to volatility amid low retail interest, modest fund inflows

Ripple (XRP) is extending its intraday decline to around $1.40 at the time of writing on Monday amid growing pressure from the retail market and risk-off sentiment that continues to keep investors on the sidelines.