Technical view following lower-than-forecast US CPI
EUR/USD
Broad-based USD weakness emerged on Wednesday following weaker-than-expected inflation out of the US. Fed funds futures traders are consequently pricing in a less aggressive rate hike for 21st September Fed meeting. According to the US Dollar Index—USD value against six international currencies— the buck plunged 1.2 per cent (its largest single-day decline since late 2020) and underpinned Europe’s single currency.
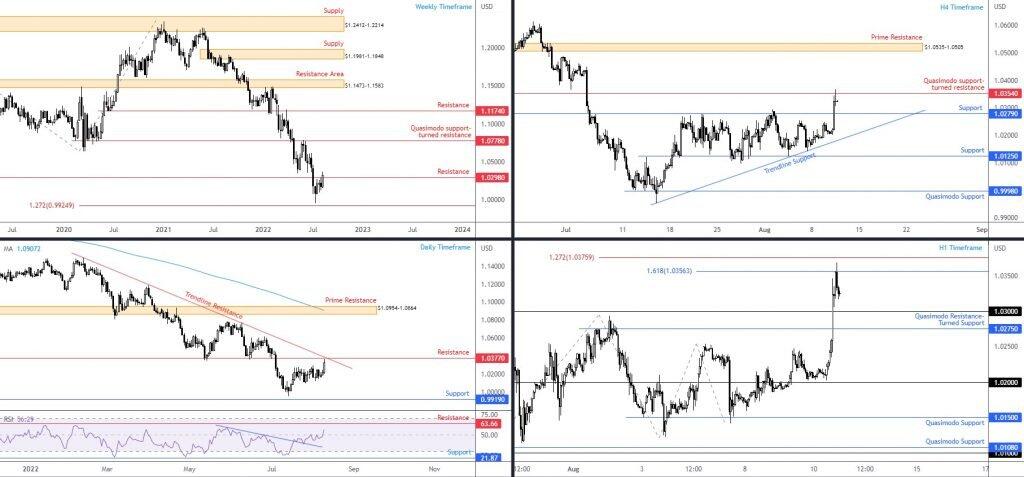
EUR/USD received a much-needed tailwind, placing resistance at $1.0298 on the weekly timeframe under pressure. A decisive close north of the aforementioned resistance may eventually see the currency pair knocking on the door of weekly resistance at $1.0778: a previous Quasimodo support level. This is reinforced by the daily timeframe’s relative strength index (RSI) venturing above its 50.00 centreline, a move informing market participants that average gains are now exceeding average losses (positive momentum on the daily chart). However, potential headwinds remain by way of a pivotal downtrend (primary bear trend) since 2021, and neighbouring resistance at $1.0377 on the daily timeframe, which happens to intersect with trendline resistance, extended from the high $1.1495.
Against the backdrop of the higher timeframes, price flow on the H4 chart shook hands with Quasimodo support-turned resistance at $1.0354. Support warrants attention at $1.0279, closely shadowed by a trendline support, pencilled in from the low $0.9952. Should the unit cross above current resistance (and take on daily resistance at $1.0377), prime resistance is seen from $1.0535-1.0505. A closer reading of price action on the H1 timeframe has the currency pair rejecting an area of resistance between $1.0376 and $1.0356, made up of two Fibonacci projection levels (1.272% and 1.618%). Territory below draws attention to $1.03 and a Quasimodo resistance-turned support at $1.0275.
Technical expectation:
While EUR/USD printed strong performance on Wednesday, considerable resistance remains overhead, and we continue to trade within a downtrend. As such, the near-test of daily resistance at $1.0377, and test of H4 Quasimodo support-turned resistance at $1.0354 as well as H1 resistance ($1.0376-1.0356) could be enough to hinder further buying.
If we test support on the H1 timeframe between $1.0275 and $1.03 (houses H4 support at $1.0279) and hold, this could be a sign that the pair is looking to take things higher. But whether a rebound from the supports would be enough to draw bullish attention is difficult to estimate, knowing where price is on the bigger picture.
Though a break of the said H1 supports implies a move back to $1.02 and opens the door to a bearish scenario.
AUD/USD
AUD/USD bulls entered an offensive phase on Wednesday amid US CPI-inspired softness and a clear risk-on environment that tends to favour the risk-sensitive Australian dollar.
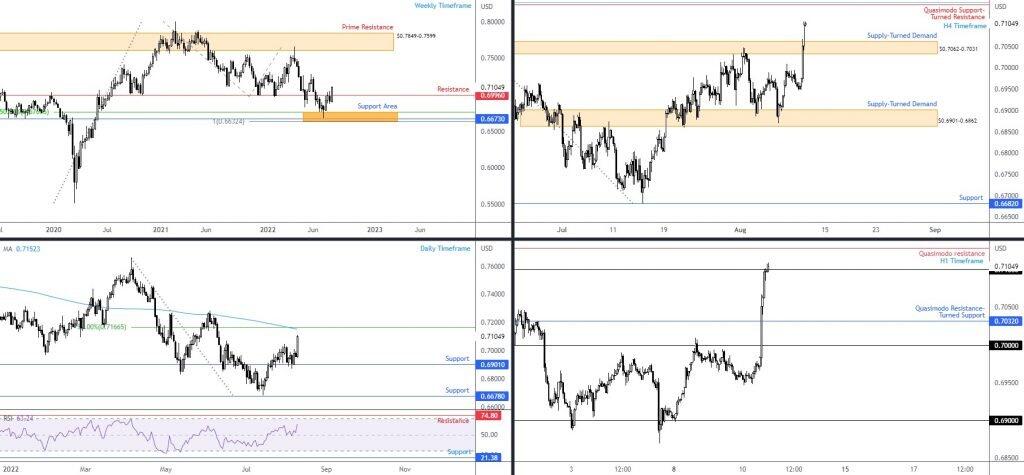
Up nearly 3.0 per cent week to date, the currency pair is on the verge of forging a close above resistance from $0.6996. Assuming a dominant finish to the week, weekly price invites an approach to as far north as prime resistance coming in at $0.7849-0.7599. This follows a rebound from weekly support between $0.6632 and $0.6764. Although the recent outperformance may incite breakout buying, the daily timeframe is within reach of touching resistance in the form of a 50% retracement at $0.7167 and the 200-day simple moving average, currently circling $0.7152 (note that moving averages can [and often do] deliver dynamic support and resistance as price commonly reverts to its mean).
Addressing the H4 timeframe shows supply-turned demand resides at $0.7062-0.7031, with scope to extend gains until Quasimodo support-turned resistance at $0.7148. There is also a deep 78.6% Fibonacci retracement present here at $0.7154. Lower on the curve, H1 price is in the process of consuming offers around $0.71, action perhaps clearing upside to Quasimodo resistance at $0.7129.
Technical expectation:
All four timeframes indicate buyers have the upper hand. The question is where will sellers attempt to put in an appearance? Breakout buyers above $0.71 are likely to take aim at H1 Quasimodo resistance at $0.7129, followed by H4 Quasimodo support-turned resistance at $0.7148 and then daily resistance (50% retracement) at $0.7167.
USD/JPY
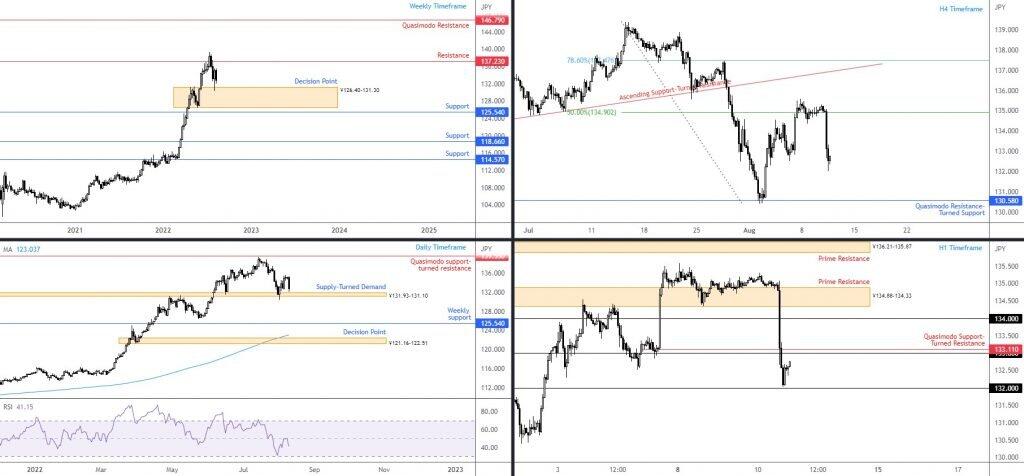
Buyers took a back seat on Wednesday as the USD/JPY plunged nearly 2.0 per cent after softer-than-anticipated US inflation data. Overall, though, this does little to affect the underlying trend in this market, dominantly higher since 2021. With that being said, the rejection from weekly resistance at ¥137.23 in mid-July may concern current longs given it is the largest correction since the uptrend started. Until the weekly decision point at ¥126.40-131.30 is overthrown, however, I do not expect to see much call for USD/JPY shorts, technically speaking.
Examining price action on the daily timeframe has the unit within a stone’s throw of supply-turned demand at ¥131.93-131.10. This is an area that has delivered a floor of support since 16th June, and a break would likely be a talking point for technical analysts as limited support is observed until reaching support at ¥125.54 (a weekly support level positioned just south of the current weekly decision point). Therefore, ¥131.93-131.10 is likely to be monitored closely.
Since 5th August, the currency pair had echoed a tentative tone around the 50% retracement at ¥134.90 until yesterday. A one-sided decline unfolded from the level and bearish forces appears to have prepared the ground for a run at Quasimodo resistance-turned support at ¥146.79. From the H1 timeframe, buyers stepped in ahead of ¥132 and now appear poised to reconnect with ¥133 and the neighbouring Quasimodo support-turned resistance level at ¥133.11. Above, ¥134 is visible as is the ¥134.88-134.33 prime resistance.
Technical expectation:
Given the pair has yet to test either the daily timeframe’s supply-turned demand area at ¥131.93-131.10, H4 Quasimodo resistance-turned support at ¥130.58, or ¥132 on the H1 timeframe, short-term sellers will likely be watching ¥133 to form resistance, bolstered by H1 Quasimodo support-turned resistance at ¥133.11.
GBP/USD
It was a good day for sterling, rallying 1.2 percent against its US counterpart following lower-than-forecast US inflation data.
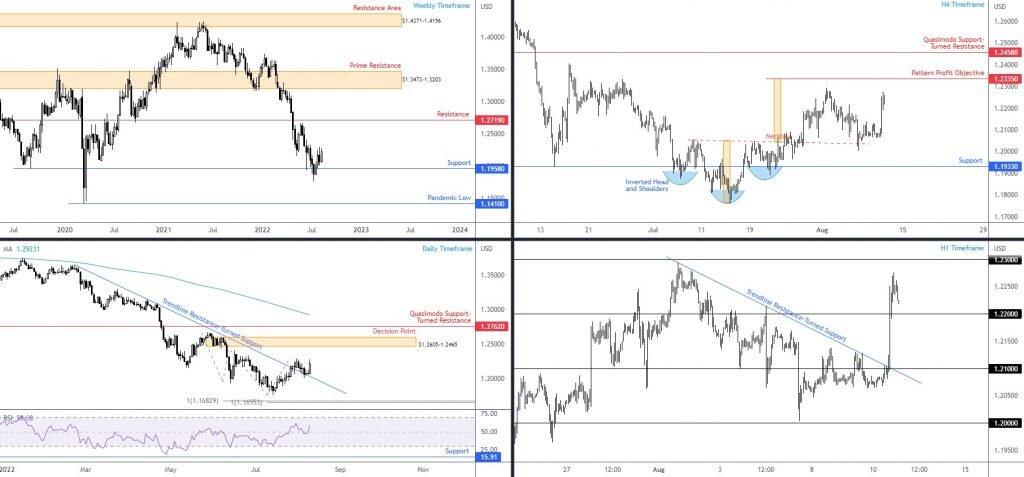
Kicking things off from the weekly timeframe, Wednesday’s performance may instil some confidence in bids from long-term weekly support at $1.1958. This is a level that has had a question mark on it as its positioned in a market trending lower since 2021. Continued interest to the upside casts light on weekly resistance at $1.2719. The recent bid is further reinforced on the daily timeframe after daily price retested (and held) trendline resistance-turned support, taken from the high $1.3639, with the chart also demonstrating space to rally until reaching a decision point at $1.2605-1.2465.
Right now, therefore, higher timeframe structure is in favour of buyers.
Thanks to recent buying, we have also seen the currency pair rebound from the H4 inverted head and shoulder’s pattern ($1.1876; $1.1760; $1.1890) neckline (from the high $1.2056). This locates the pattern’s take-profit level from $1.2335 back in the frame.
In terms of where I stand on the H1 chart at the moment, you will note the candles manoeuvred above $1.22 and swiftly retested the level as support. I do not see much in the way of resistance on this timeframe until the $1.23 region.
Technical expectation:
According to the four charts analysed, buyers are likely to remain in command.
Another retest of $1.22 on the H1 timeframe, therefore, could offer buyers a platform to work with, targeting $1.23, and then the H4 timeframe’s pattern (inverted H&S) profit objective at $1.2335.
Author

Aaron Hill
FP Markets
After completing his Bachelor’s degree in English and Creative Writing in the UK, and subsequently spending a handful of years teaching English as a foreign language teacher around Asia, Aaron was introduced to financial trading,


