Technical analysis: USD/JPY advances stumble at near 4-year highs

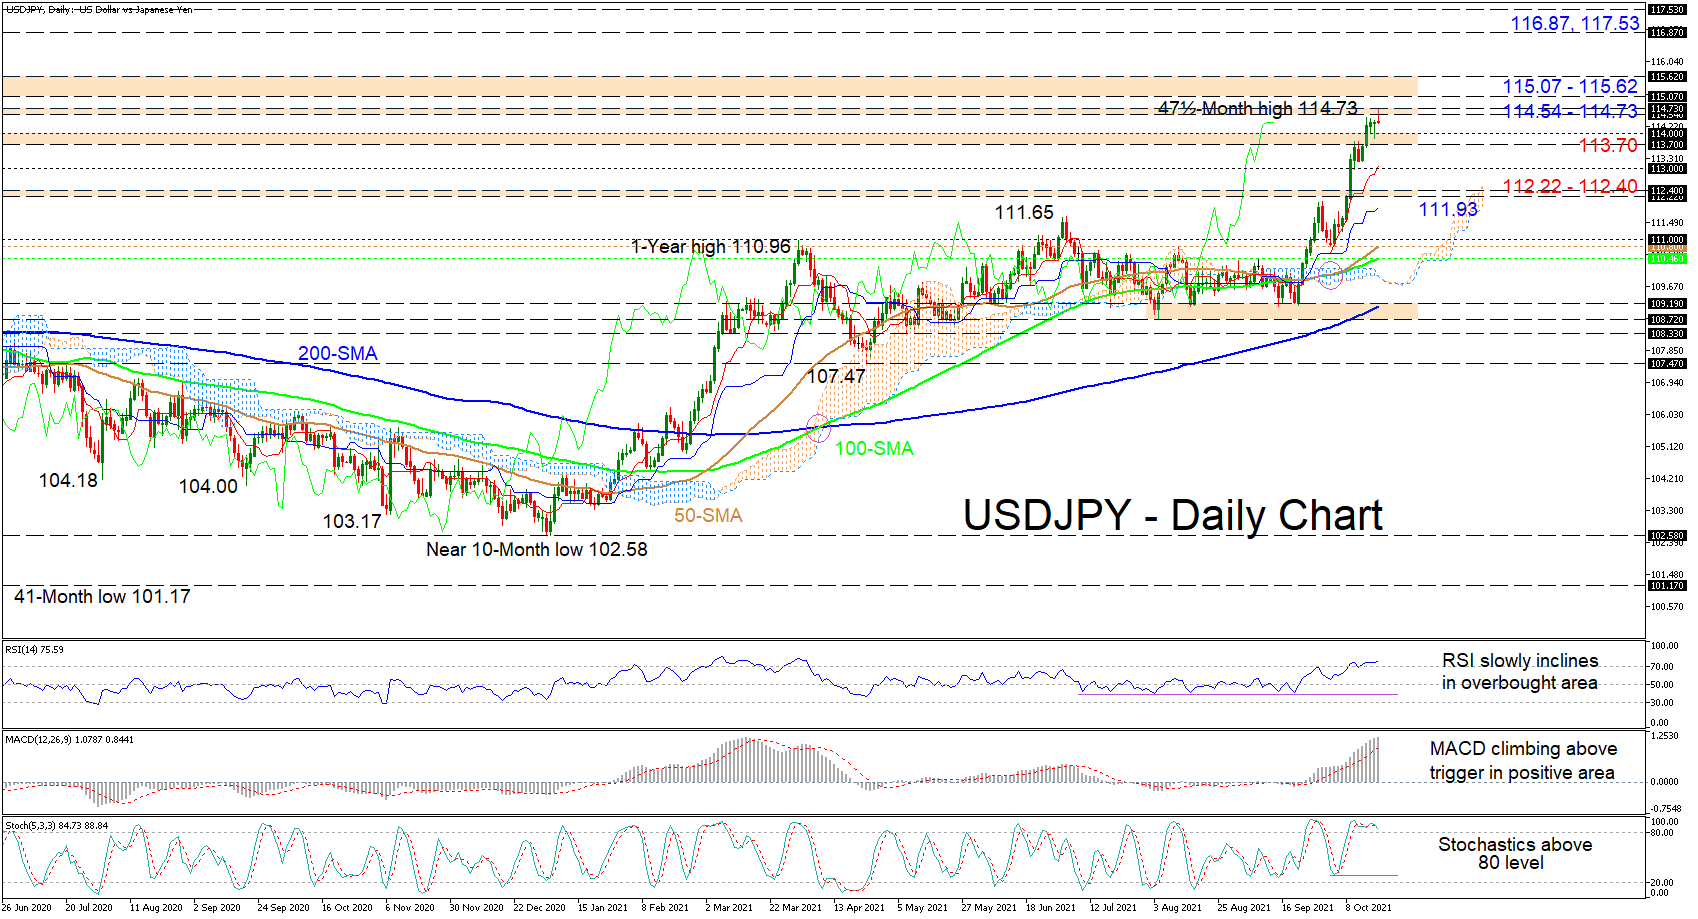
USDJPY’s one-month rally off 109.19 may be running out of steam in the vicinity of the resistance band of 114.54-114.73, formed between the October 2018 and November 2017 rally peaks. Nonetheless, the climbing simple moving averages (SMAs) are endorsing the bullish picture.
The Ichimoku lines are indicating that positive momentum is growing, while the short-term oscillators are still leaning towards the upside. The MACD, deep in the positive region, is persisting above its red trigger line, while the RSI, which is in overbought territory, is demonstrating a tendency to push higher. Currently, the stochastic lines are tangled above the 80 overbought levels, not providing a clear price preference.
In the positive scenario, an immediate obstacle impeding the extension of the one-month rally is the 114.54-114.73 barrier. However, if buyers successfully overstep this slender resistance, upside limitations could arise from the neighbouring boundary of 115.07-115.62, involving multiple highs from mid-January to mid-March of 2017. Should bullish impetus intensify, the price may then propel for the 116.87 and 117.53 highs, identified in January of 2017.
Alternatively, if price gains become capped ahead of the 115.00 handles, preliminary support could develop around the 113.70 - 114.00 region. Dropping below this, upside defences could stem from the 113.00 hurdles, and the 112.22-112.40 boundary, moulded between the highs from April 2019 and February 2020. From here, a deeper price retracement could get snagged around the blue Kijun-sen line at 111.93 before challenging the zone of support between the 111.00 level and the 100-day SMA at 110.46.
Summarizing, USDJPY is sustaining a bullish tone above the 113.00 barriers and the SMAs. For positive forces to flourish, the price would need to pilot past the 115.62 thresholds, while a drop beneath the 113.00 handles could start to feed negative price movements.
Author

Anthony Charalambous joined XM in 2019 and specializes in preparing daily technical analysis, using his years of trading experience to provide detailed forecasting for all major asset classes such as forex, indices, commodities and equities.


