USD/CAD technical analysis: Finds traction off 100-SMA and faces instant barrier

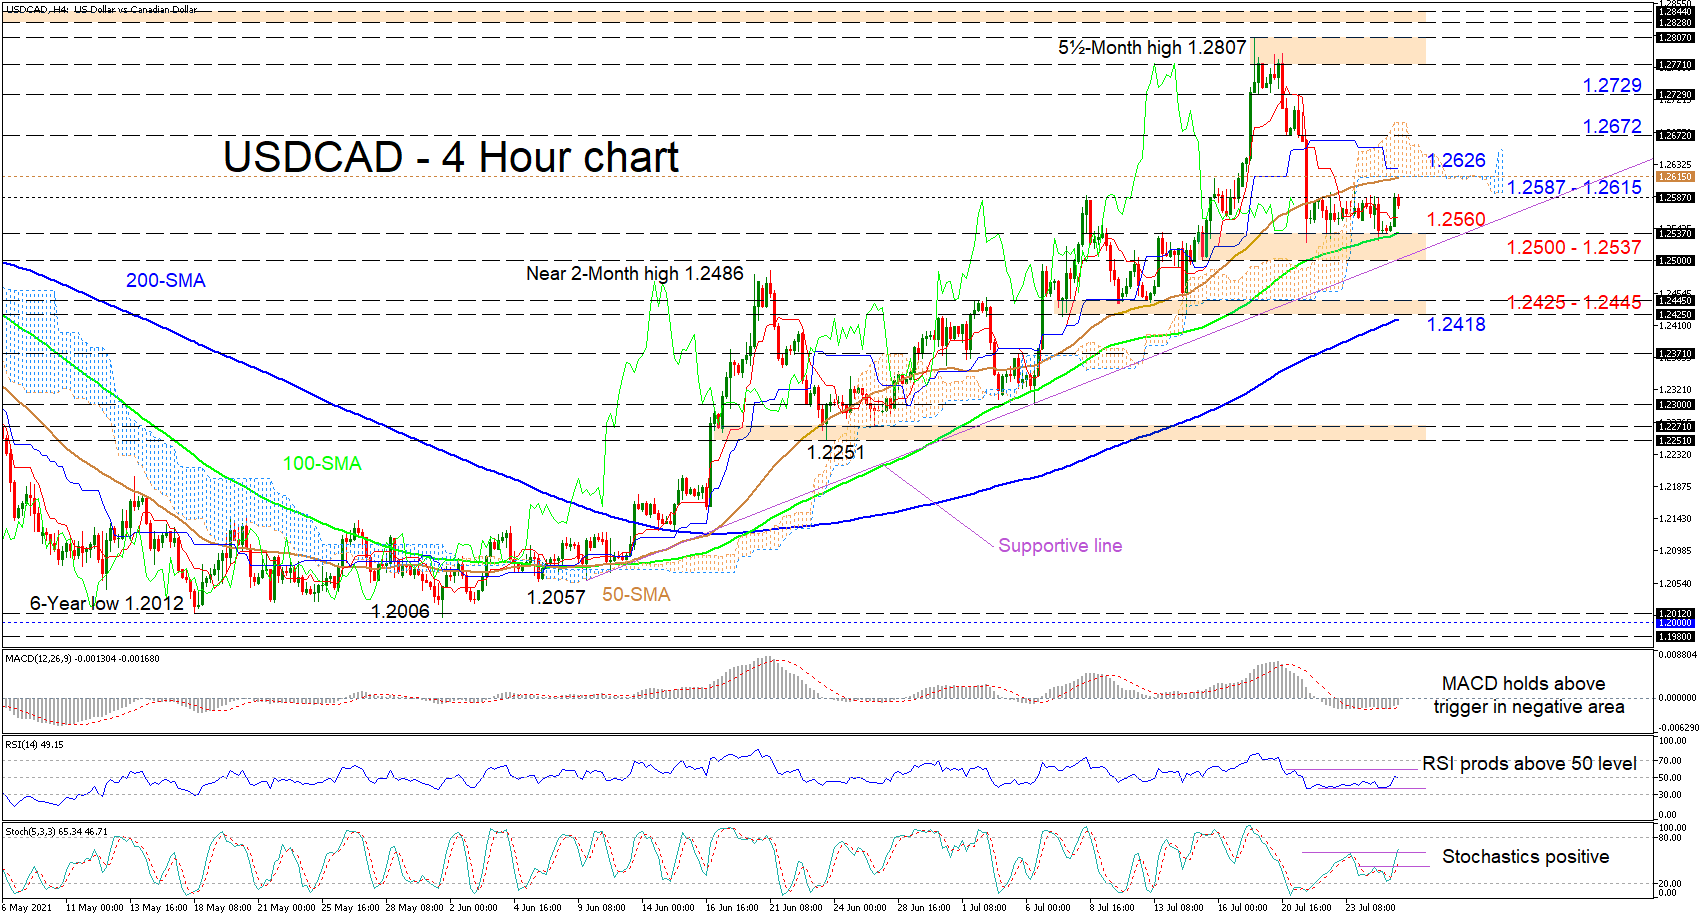
USDCAD is confronting an immediate resistance zone from a line-up of recent familiar highs around 1.2587 until the Ichimoku cloud’s lower surface at 1.2615. The advancing simple moving averages (SMAs) are defending the short-term upside structure, in spite of the price pullback from the 5½-month high of 1.2807.
The consolidation in the price after the plunge is showing that downside pressures have somewhat subsided, as the pair acquires some footing off the 100-period SMA as well. The stance in the Ichimoku lines further suggests that negative momentum has somewhat dried up, while the short-term oscillators are confirming a spark in opposing positive sentiment. The MACD, in the negative region, is holding above its red trigger line, while the RSI is signaling that buyers are fighting to sustain the upward drive. The positively charged stochastic oscillator is also promoting bullish price action.
If sellers gain a clear advantage, initial critical downside constraints may arise from the nearby support section formed from the 100-period SMA, at the 1.2537 low until the 1.2500 handles, fortified by an overlapping supportive line pulled from the 1.2057 marks. Should the price break beneath these critical barricades, the 1.2425-1.2445 base, reinforced by the 200-period SMA at 1.2418, could apply the brakes to the decline before it gains a significant downside pace.
To the upside, buyers could encounter an immediate tough resistance zone from the 1.2587 barriers until the 50-period SMA, residing at the cloud’s lower surface of 1.2615. Pushing higher, the blue Kijun-sen line at 1.2626 and the cloud may impede the pair from steering towards the inside swing low of 1.2672. Should buying interest persist past the 1.2672 obstacles, this could cheer the bulls to test the 1.2729 high, keeping their eyes on the peak.
Summarizing, USDCAD’s short-term picture is sustaining a bullish tone on the condition that the price persists above the 1.2500 hurdles, the supportive line, and the 200-period SMA.
Author

Anthony Charalambous joined XM in 2019 and specializes in preparing daily technical analysis, using his years of trading experience to provide detailed forecasting for all major asset classes such as forex, indices, commodities and equities.


