Technical analysis: Gold breaches trendline, EUR/USD slips below 1.07 again

Gold breaches trendline as sentiment sours
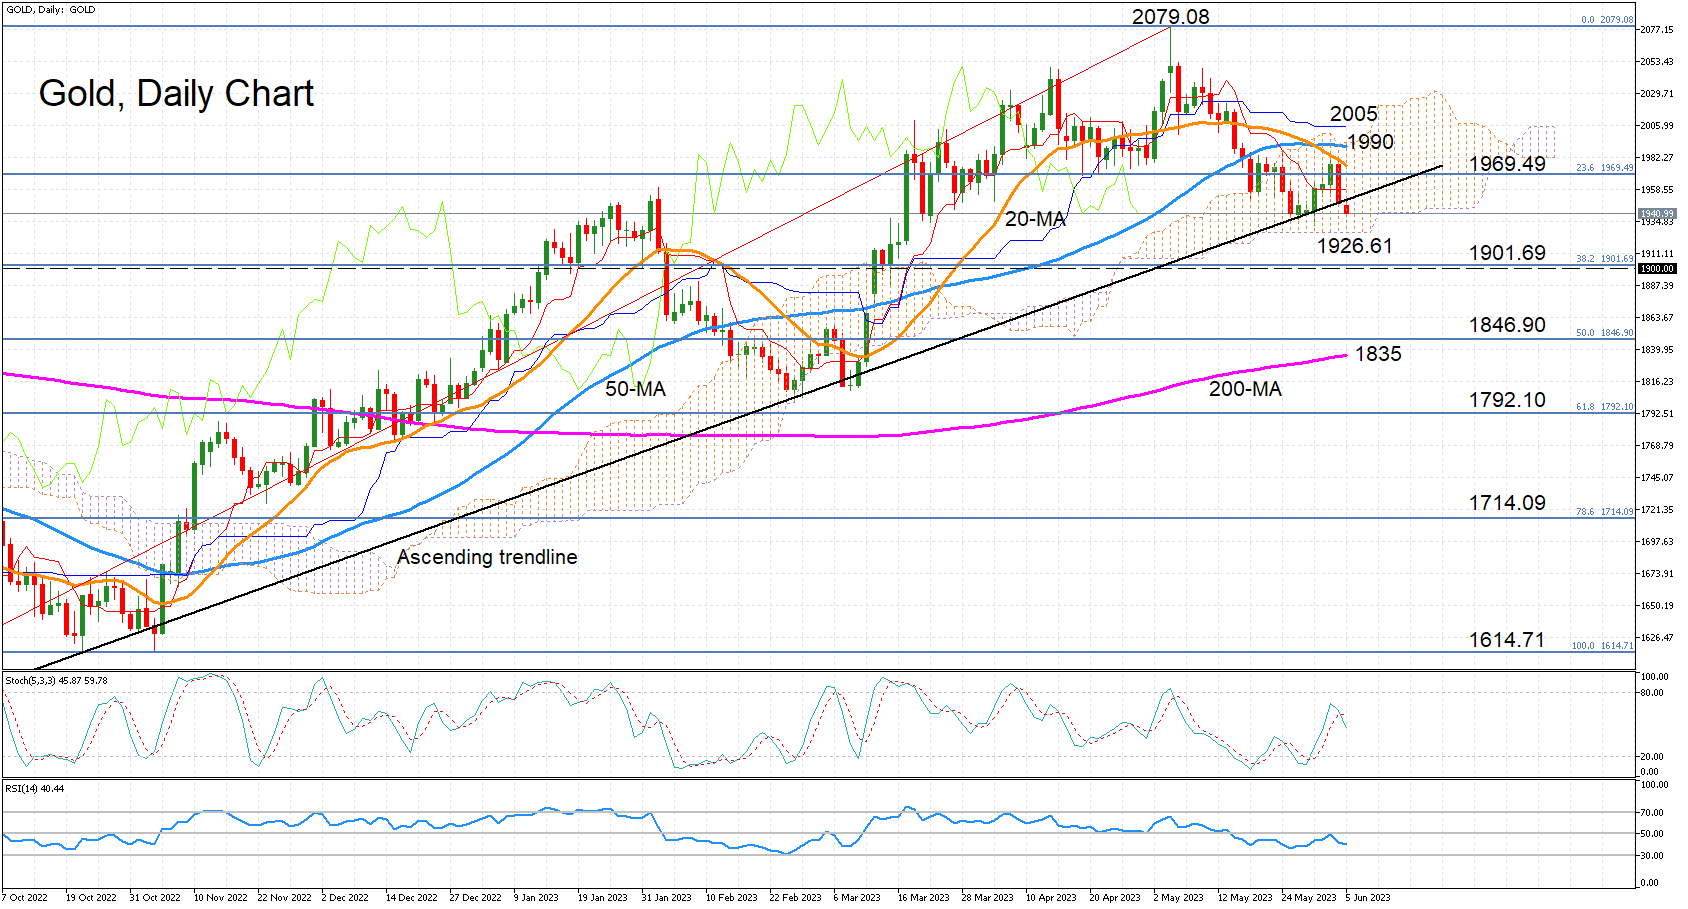
Gold has breached its ascending trendline and could soon drop below the Ichimoku cloud as well, as the short-term momentum indicators are pointing down. The %K and D% lines of the stochastic oscillator have posted a bearish crossover, while the RSI is heading lower after failing to climb above the 50 neutral threshold.
Immediate support is likely to come at the cloud bottom just above 1,926, while the crucial 1,900 barrier is not that far below and is being reinforced by the 38.2% Fibonacci retracement of the September 2022-May 2023 uptrend. If the selling pressure deepens and gold plummets below 1,900, the bears are likely to set their sights on the 200-day simple moving average (SMA) around 1,835. Although, they would first have to get through the 50% Fibonacci of 1,846.90.
In the event that the precious metal is able to claw back above the trendline, there are several obstacles ahead. The 20-day SMA is inclining downwards and about to intersect the 23.6% Fibonacci of 1969.49, the 50-day SMA is blocking the exit from the cloud at 1,990 and the Kijun-sen line is waiting at 2,005.
Even if gold is able to clear those hurdles, it is some distance away from the May peak of 2,079.08, which it needs to surpass to put its uptrend back on track. Otherwise, there’s a risk that the slide will eventually hit the 200-day SMA, which breaching it would endanger the longer-term bullish picture.
EUR/USD slips below 1.07 again as rebound falters
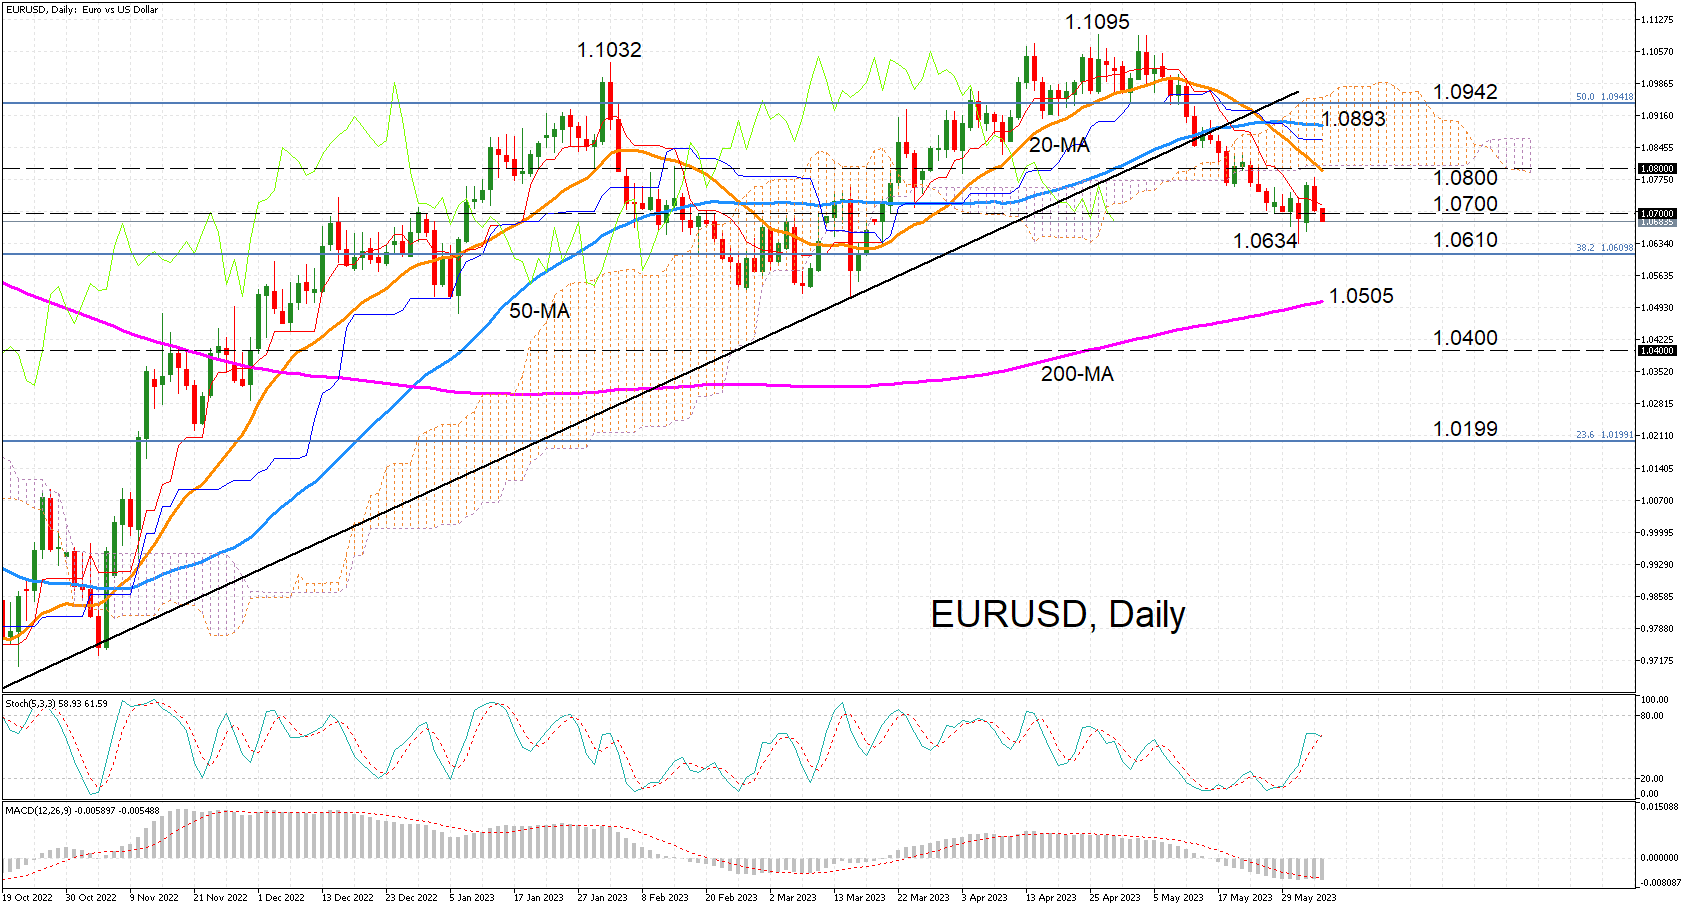
EURUSD is back under selling pressure as the rebound from last week’s two-month low of 1.0634 has suffered an early setback. The 1.0700 handle is in danger of being surrendered again as the momentum indicators aren’t looking very encouraging right now.
The fast stochastic oscillator (%K) is about to cross below the slow stochastic (%D), while the MACD has slid back below its red signal line.
If the bearish bias persists in the short term, the 38.2% Fibonacci retracement of the January 2021-September 2022 at 1.0610 is the next major support that could prop up prices. But should it fail, attention would quickly turn to the 200-day simple moving average (SMA) just above 1.0500, which also coincides with the lows from January and March. Even lower, the 1.0400 level could be targeted, before the 23.6% Fibonacci of 1.0199 comes into range.
However, if the pair is able to find its footing and bounces higher, there could be trouble in the 1.0800 region as both the 20-day SMA and the bottom of the Ichimoku cloud are barricading this area. A successful entry into the cloud would not be problem free as the 50-day SMA is hovering around 1.0893 and the 50% Fibonacci is positioned slightly higher at 1.0942.
To sum up, EURUSD’s downside correction doesn’t appear to be over yet, and should it extend all the way until the 200-day SMA, the bullish medium-term outlook would be at risk of switching to bearish. Moreover, unless the price can top the April peak of 1.1095 soon, the pair could be stuck in a consolidation phase.
Author

Mr Boyadjian graduated from the London School of Economics in 1999 with a BSc in Business Mathematics and Statistics. Following graduation, he joined PricewaterhouseCoopers in the Business Recoveries team, where he was responsibl


