Technical analysis: GBP/USD nears 1.38 mark, bullish bearing intact

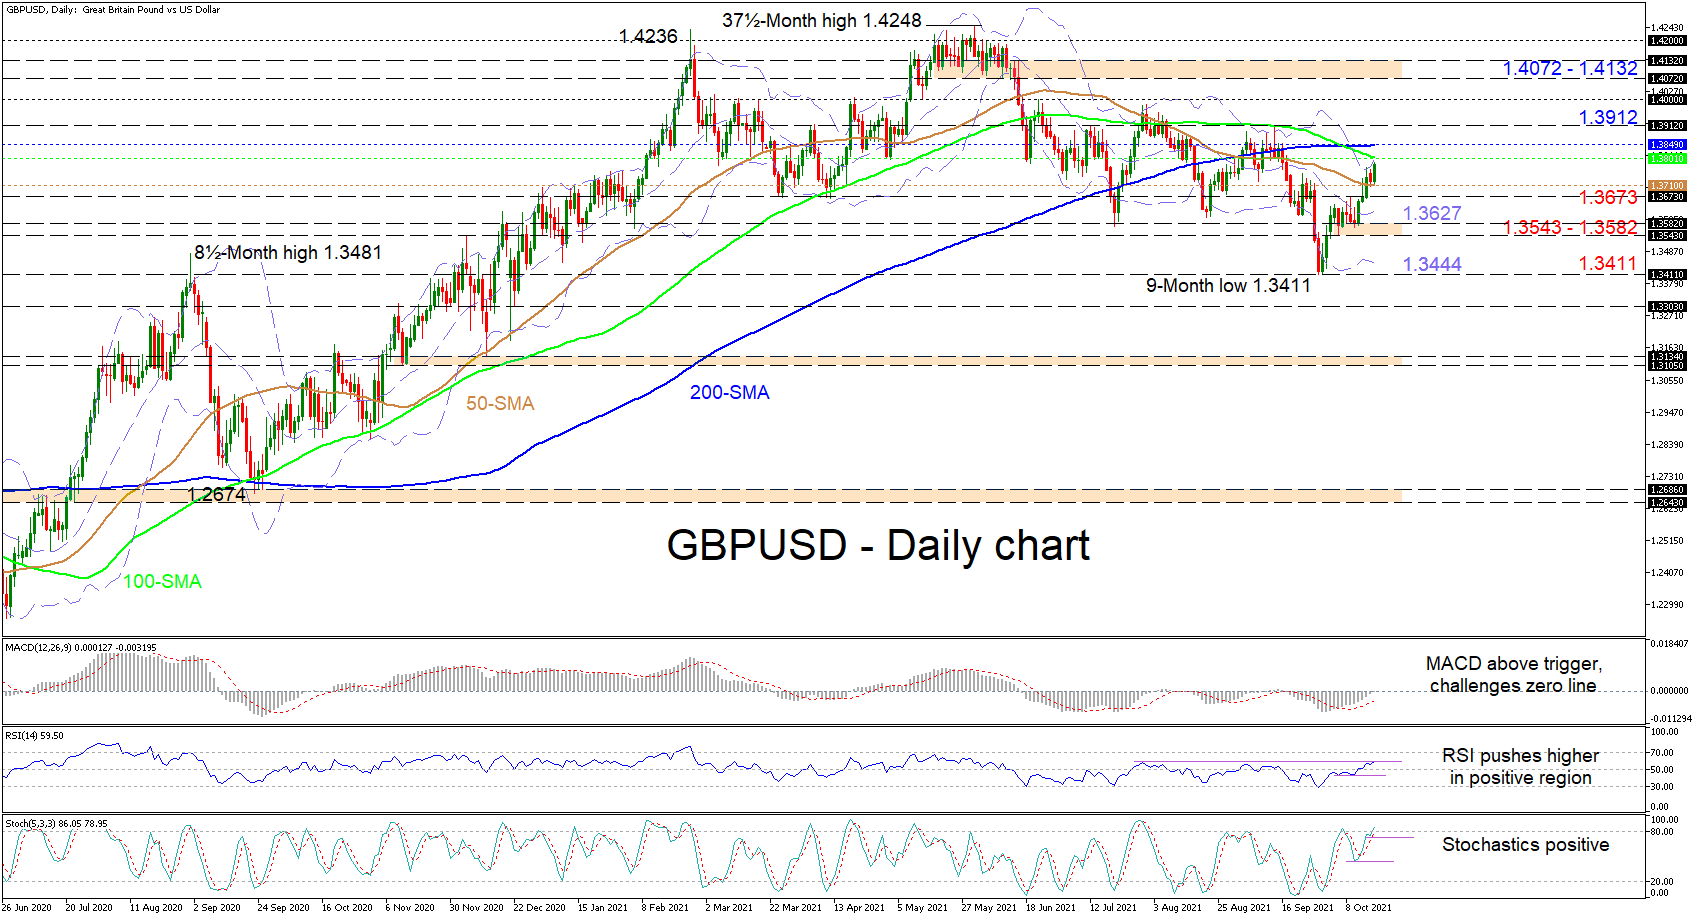
GBPUSD is pushing up against the upper Bollinger band, which is converging with the 100-day simple moving average (SMA) at 1.3801, trying to extend further the hike from the 9-month low of 1.3411. The 200-day SMA is endorsing a neutral tone, while the bearish demeanour in the 50- and 100-day SMAs seems to be easing.
The short-term oscillators are reflecting an increase in positive momentum in the pair. The MACD has advanced above its red trigger line and is currently flirting with the zero line, while the RSI is making headways in the bullish territory. The stochastic oscillator has resumed a positive charge with the %K line pushing into the overbought zone, which is promoting bullish price action in the pair.
If the price maintains the current trajectory, prompt resistance could arise from the area between the 100- and 200-day SMAs at 1.3801 and 1.3849 respectively. Conquering this tough upside constraint, the nearby high of 1.3912 may try to halt the ascent from testing the highs around the 1.4000 border. Should the pair successfully overcome the 1.4000 obstacle, the bulls could then turn their focus to the resistance zone of 1.4072-1.4132.
Alternatively, if the 100-day SMA caps additional gains, sellers may encounter initial downside friction among the 50-day SMA at 1.3710 and the 1.3673 barrier. Diving lower, the price could hit the mid-Bollinger band at 1.3627 before meeting the support band of 1.3543-1.3582, where the early October lows reside. If selling interest persists, a deeper decline may turn its attention to the lower Bollinger band at 1.3444 and the adjacent 9-month trough of 1.3411.
Summarizing, GBPUSD is exhibiting a strong bullish tone above the 1.3700 handle. A thrust past the 1.3912 high could bolster upside impetus, while a price retreat below the 1.3543 low may provide negative forces with fuel.
Author

Anthony Charalambous joined XM in 2019 and specializes in preparing daily technical analysis, using his years of trading experience to provide detailed forecasting for all major asset classes such as forex, indices, commodities and equities.


