Technical Analysis #C-SUGAR: 2019-02-21

There are risks of reduction in global sugar production
Because of weather conditions, sugar production may decline in the EU, Brazil, India and Thailand. Will Sugar pricesrise?
The Brazilian Sugarcane Industry Association (UNICA) reported a decrease in sugarcane harvest in the 2018/19 agricultural season in Brazil and a 26.4% reduction in sugar production in the southern and central parts of the country according to data from April 2018 to the beginning of February 2019. At the same time, bioethanol production in January of the current year increased by 32.5% compared with January 2018 and reached 1.83 billion liters. Sugar and biofuels in Brazil are produced from the same type of raw material - sugarcane and they compete with each other. In 2018, bioethanol production increased by 42% compared with 2017 and amounted to 19.4 billion liters. Amid this, sugar exports from Brazil in January 2019 amounted to 1.1 million tons. It decreased by 32.3% compared with December 2018 and by 30% compared with January 2018. The Indian National Federation of Cooperative Sugar Factories forecasts a decrease in sugar production in India because of bad weather conditions in the current season.
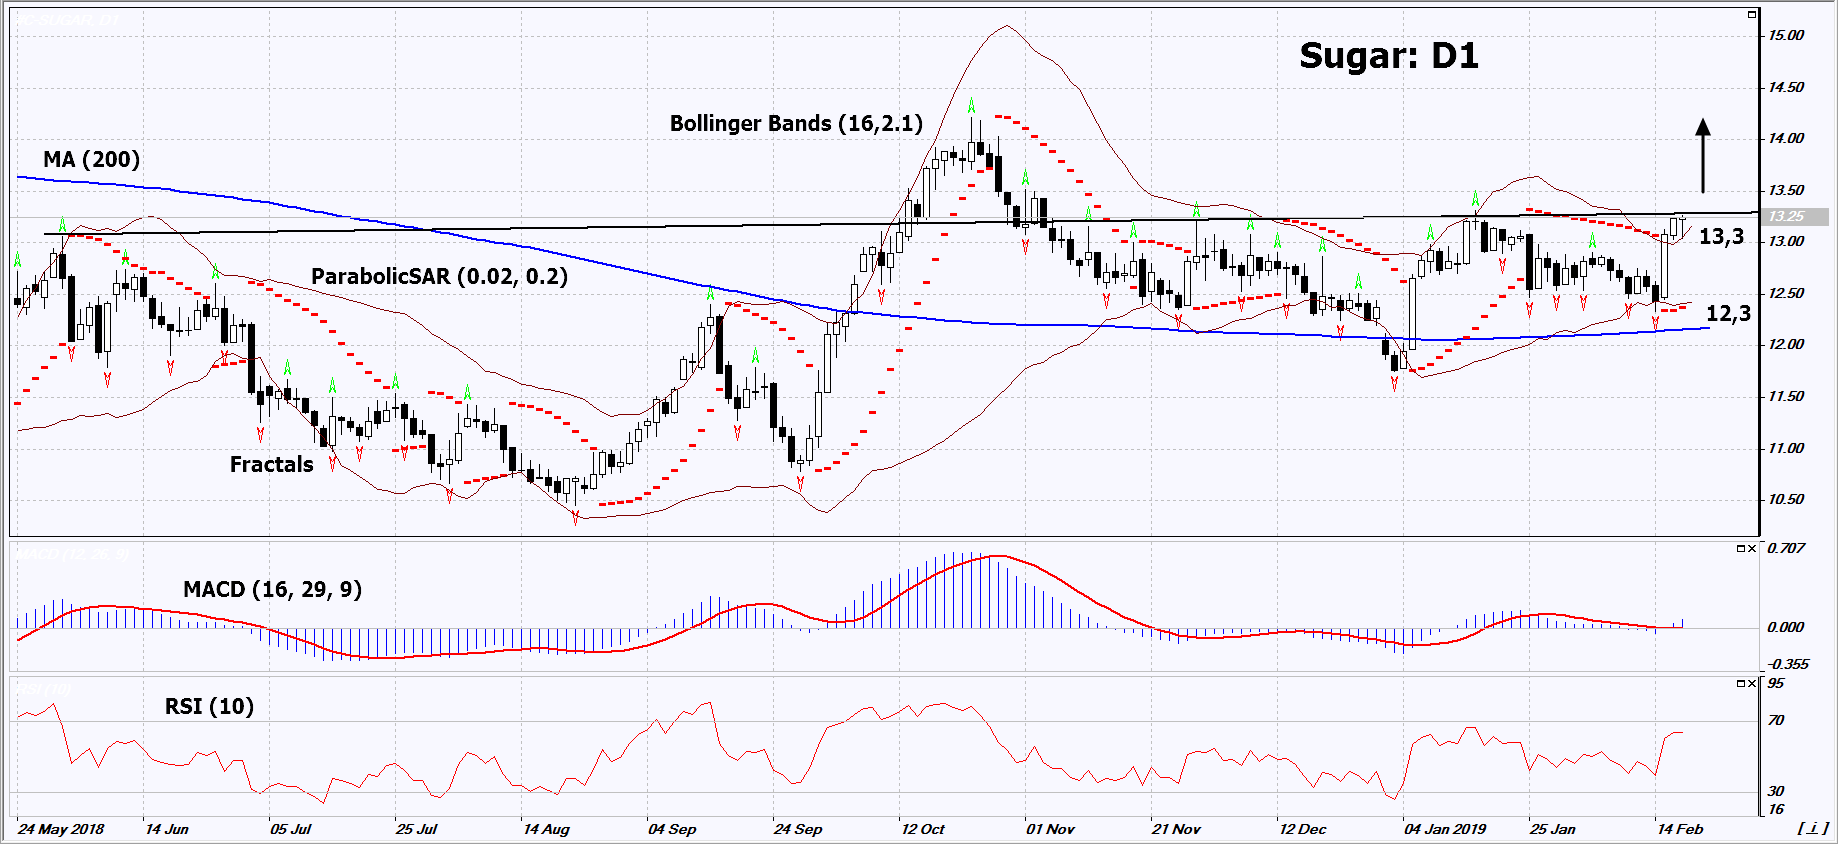
On the daily timeframe, Sugar: D1 again approached the upper boundary of the wide neutral range. It should be breached up before opening a buy position. A number of technical analysis indicators formed buy signals. The further price increase is possible in case of a reduction in world production.
-
The Parabolic Indicator gives a bullish signal.
-
The Bollinger bands have narrowed, which indicates low volatility. Both Bollinger bands are titled upwards.
-
The RSI indicator is above 50. No divergence.
-
The MACD indicator gives a bullish signal.
The bullish momentum may develop in case Sugar exceeds the two last fractal highs at 13.3. This level may serve as an entry point. The initial stop loss may be placed below the last fractal low, the Parabolic signal, the lower Bollinger band and the 200-day moving average line at 12.3. After opening the pending order, we shall move the stop to the next fractal low following the Bollinger and Parabolic signals. Thus, we are changing the potential profit/loss to the breakeven point. More risk-averse traders may switch to the 4-hour chart after the trade and place there a stop loss moving it in the direction of the trade. If the price meets the stop level (12.3) without reaching the order (13.3), we recommend to close the position: the market sustains internal changes that were not taken into account.
Summary of technical analysis
|
Position |
Buy |
|
Buy stop |
Above 13.3 |
|
Stop loss |
Below 12.3 |
Want to get more free analytics? Open Demo Account now to get daily news and analytical materials.
Want to get more free analytics? Open Demo Account now to get daily news and analytical materials.
Author

Dmitry Lukashov
IFC Markets
Dimtry Lukashov is the senior analyst of IFC Markets. He started his professional career in the financial market as a trader interested in stocks and obligations.


