Gold Weekly Forecast: Renewed Middle East tensions scare bulls away
- Gold failed to build on the previous week’s gains as tensions in the Middle East re-escalated.
- US inflation data and Fed Chair Warsh’s testimony could trigger the next big move in XAU/USD.
- The near-term technical outlook shows that Gold has failed to complete its bullish reversal.

Gold (XAU/USD) lost its bullish momentum after rising more than 2% in the previous week and registered weekly losses as investors reacted to a clear re-escalation of tensions in the Middle East. July inflation data from the United States (US) and comments from Federal Reserve (Fed) Chair Kevin Warsh could drive XAU/USD’s action in the near term.
Gold falls as US and Iran exchange strikes
Markets opened the week in a calm manner and Monday’s action remained subdued as trading conditions normalized following a long weekend in the US.Data from the US showed that business activity in the service sector continued to expand at a healthy pace in June, with the Institute for Supply Management’s (ISM) Services Purchasing Managers’ Index (PMI) coming in at 54. The Employment Index of the PMI report improved to 51.2 from 47.9, highlighting an increase in the sector’s payrolls.
After posting small losses on Monday, Gold came under renewed bearish pressure early Tuesday as tensions in the Middle East escalated once again. Iran’s Islamic Revolutionary Guard Corps (IRGC) reportedly attacked a commercial ship sailing near the Strait of Hormuz on Monday, and US President Donald Trump told reporters that the US would either reach a deal or "finish the job."
Later in the day, the US announced that it revoked the license that permitted Iran to sell crude Oil until August 21 and reimposed sanctions, and the US military launched retaliatory strikes against Iranian air defences and drone launch sites. The barrel of West Texas Intermediate (WTI) rose more than 5% on the day, while Gold lost about 1.5% and continued to push lower on Wednesday.
While speaking to reporters at the NATO summit on Wednesday, US President Donald Trump said that the Memorandum of Understanding with Iran was over and threatened to hit Iran again. Trump further added that he wasn’t sure if the deal “will stick” and that they could take over Kharg Island. Gold extended its slide into a third consecutive day and closed in negative territory.
Although the US and Iran continued to exchange strikes early Thursday, the US Dollar (USD) lost its strength and allowed XAU/USD to stage a rebound. The bullish action seen in Wall Street’s main indexes pointed to an improving risk mood in the second half of the day and made it difficult for the USD to find demand. Furthermore, the US and Iran stopped launching strikes late Thursday, and citing a US official, Al Jazeera reported that Washington remains committed to diplomacy to find a resolution and added that technical talks continue.
Gold rose more than 1% on Thursday and erased a portion of its weekly losses before stabilizing at around $4,100 on Friday.
Gold investors await Fed Chair Warsh’s testimony
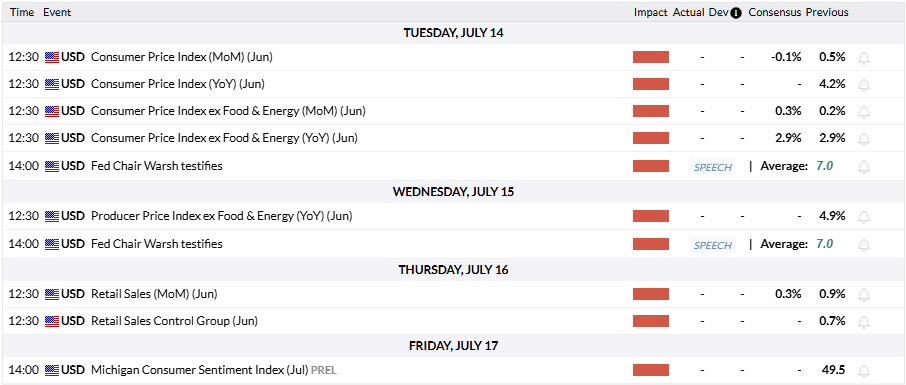
The US Bureau of Labor Statistics (BLS) will publish the Consumer Price Index data for June on Tuesday. Investors expect the monthly CPI to decline by 0.1% following the 0.5% increase reported in May.
A positive print could feed into inflation fears and make it difficult for XAU/USD to keep its footing. Conversely, a print at or below the market forecast could have the opposite effect on the pair. Nevertheless, the market reaction to inflation data could remain short-lived, with investors refraining from committing to large positions ahead of Fed Chair Kevin Warsh’s testimony on the Semiannual Monetary Policy Report.
Fed Chair Warsh will deliver a prepared speech and respond to questions before the US House Financial Services Committee on Tuesday, and will do the same before the US Senate Committee on Banking, Housing and Urban Affairs on Wednesday.
In his first public appearance at the European Central Bank’s (ECB) Forum on Central Banking on July 1, Warsh made it clear that he is against providing forward guidance but noted that if anyone thought that they would be happy with inflation above 2%, “they will be disappointed."
Hence, Warsh is unlikely to offer any clues regarding the timing of a possible interest rate hike. According to the CME FedWatch Tool, Markets are currently pricing in about a 20% probability of the Fed raising the interest rate by 25 basis points (bps) at its July meeting, and see around a 60% chance that this will happen in September.
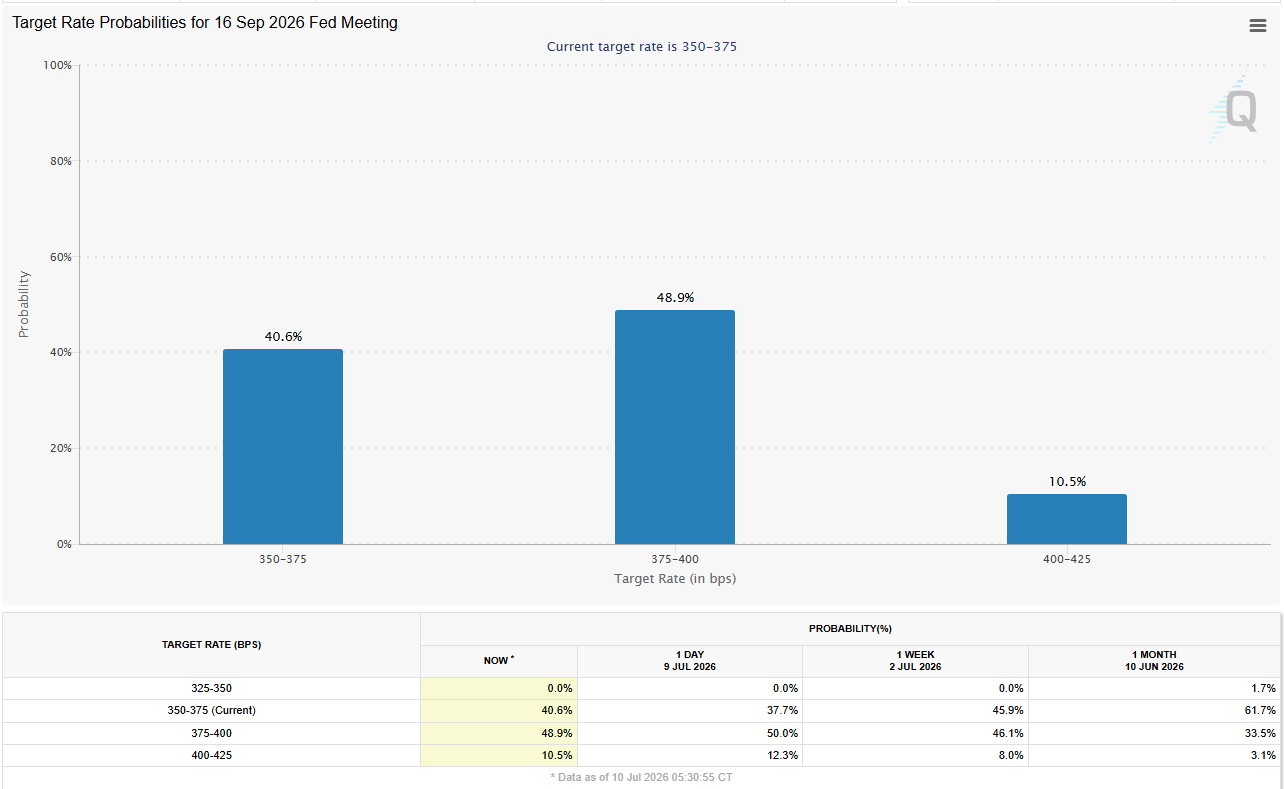
At this point, it would take a significant upside surprise in June inflation data or a sharp and steady increase in crude Oil prices for markets to reconsider the probability of a July hike. Gold could come under heavy bearish pressure and target a fresh 2026-low in this scenario.
Commenting on Gold’s near-term action, ING strategists Warren Patterson and Ewa Manthey note that “official-sector demand” remains supportive for the precious metal, explaining that the latest data from the People's Bank of China showed it increased its Gold reserves for a 20th consecutive month in June.
"The continued accumulation highlights China's ongoing efforts to diversify reserves and reinforces a broader trend of strong central bank buying. It should continue to provide an important source of support for Gold prices despite recent volatility,” they add.
Gold technical analysis: Bullish momentum fades before reversal is completed
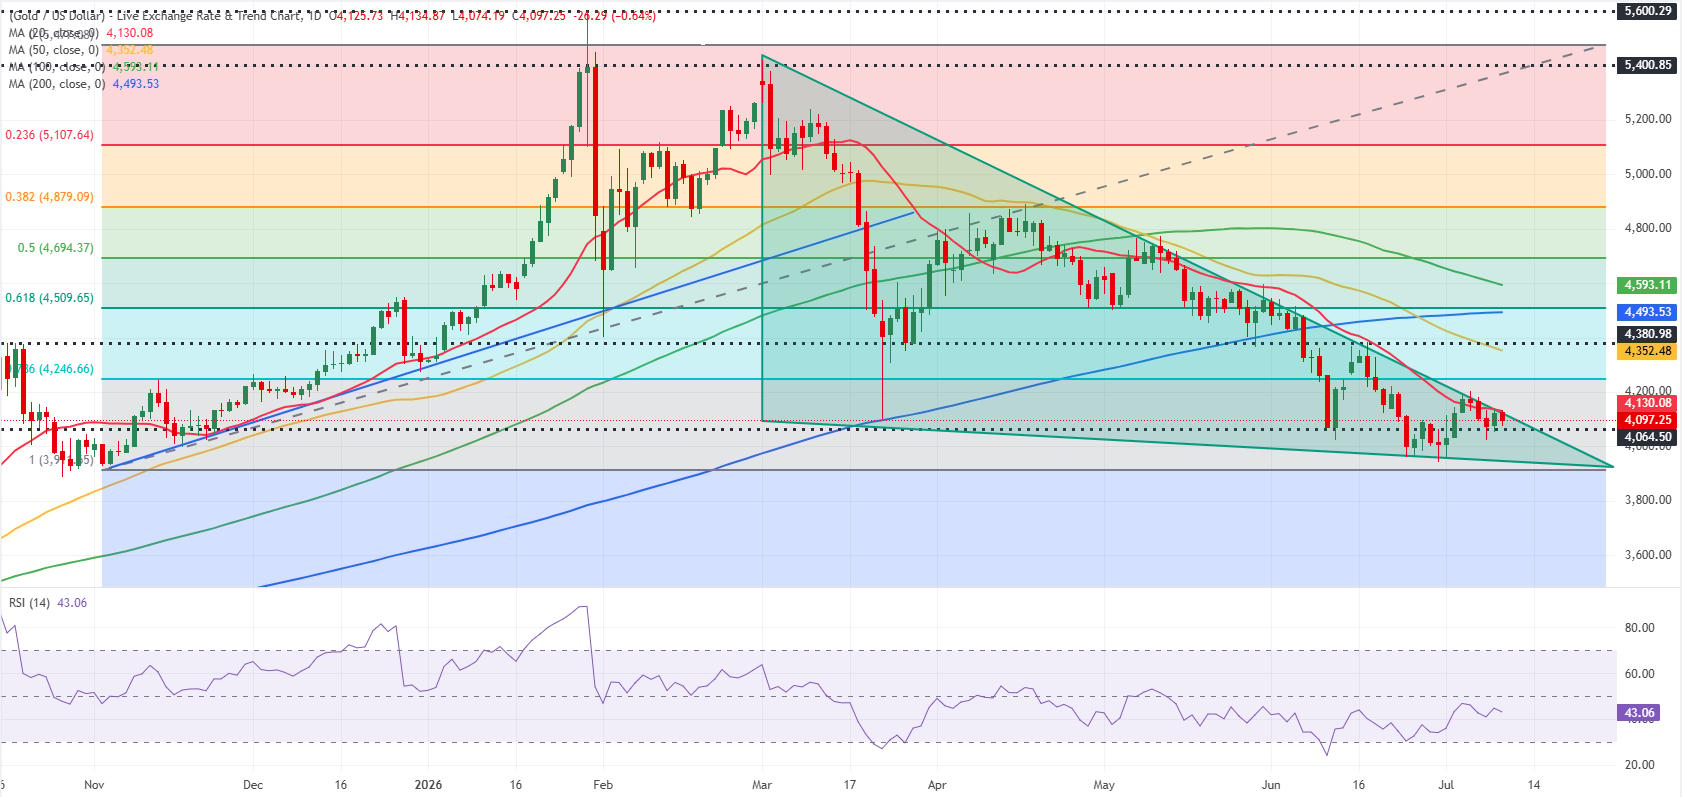
Gold stays below the descending March-July trend line and trades a tad below the 20-day Simple Moving Average (SMA), and the Relative Strength Index (RSI) indicator on the daily chart sits underneath 50, pointing to a lack of buyer interest.
If Gold manages to stabilize above $4,130 (20-day SMA, descending trend line) and confirms that level as support, technical sellers could move to the sidelines. In this scenario, $4,250 (Fibonacci 78.6% retracement of the November-February uptrend) could be seen as the next resistance level before $4,350 (50-day SMA) and $4,500-$4,510 (Fibonacci 61.8% retracement, 200-day SMA).
On the downside, a strong support area seems to have formed at $4,000-$3,950 (round level, static level). If buyers fail to keep Gold afloat above this region, $3,915-$3,900 (static level, round level) could be seen as the next immediate support area ahead of $3,800 (static level, round level).
Gold FAQs
Gold has played a key role in human’s history as it has been widely used as a store of value and medium of exchange. Currently, apart from its shine and usage for jewelry, the precious metal is widely seen as a safe-haven asset, meaning that it is considered a good investment during turbulent times. Gold is also widely seen as a hedge against inflation and against depreciating currencies as it doesn’t rely on any specific issuer or government.
Central banks are the biggest Gold holders. In their aim to support their currencies in turbulent times, central banks tend to diversify their reserves and buy Gold to improve the perceived strength of the economy and the currency. High Gold reserves can be a source of trust for a country’s solvency. Central banks added 1,136 tonnes of Gold worth around $70 billion to their reserves in 2022, according to data from the World Gold Council. This is the highest yearly purchase since records began. Central banks from emerging economies such as China, India and Turkey are quickly increasing their Gold reserves.
Gold has an inverse correlation with the US Dollar and US Treasuries, which are both major reserve and safe-haven assets. When the Dollar depreciates, Gold tends to rise, enabling investors and central banks to diversify their assets in turbulent times. Gold is also inversely correlated with risk assets. A rally in the stock market tends to weaken Gold price, while sell-offs in riskier markets tend to favor the precious metal.
The price can move due to a wide range of factors. Geopolitical instability or fears of a deep recession can quickly make Gold price escalate due to its safe-haven status. As a yield-less asset, Gold tends to rise with lower interest rates, while higher cost of money usually weighs down on the yellow metal. Still, most moves depend on how the US Dollar (USD) behaves as the asset is priced in dollars (XAU/USD). A strong Dollar tends to keep the price of Gold controlled, whereas a weaker Dollar is likely to push Gold prices up.
Author

Eren Sengezer
FXStreet
As an economist at heart, Eren Sengezer specializes in the assessment of the short-term and long-term impacts of macroeconomic data, central bank policies and political developments on financial assets.

















