Technical analysis : Will the growth of oats quotes continue?

Recommendation for oats: Buy
Buy Stop: Above 392.
Stop Loss: Below 349.
RSI: Neutral.
MACD: Buy.
MA(200) : Neutral.
Fractals: Buy.
Parabolic SAR: Buy.
Bollinger Bands: Neutral.
Chart analysis
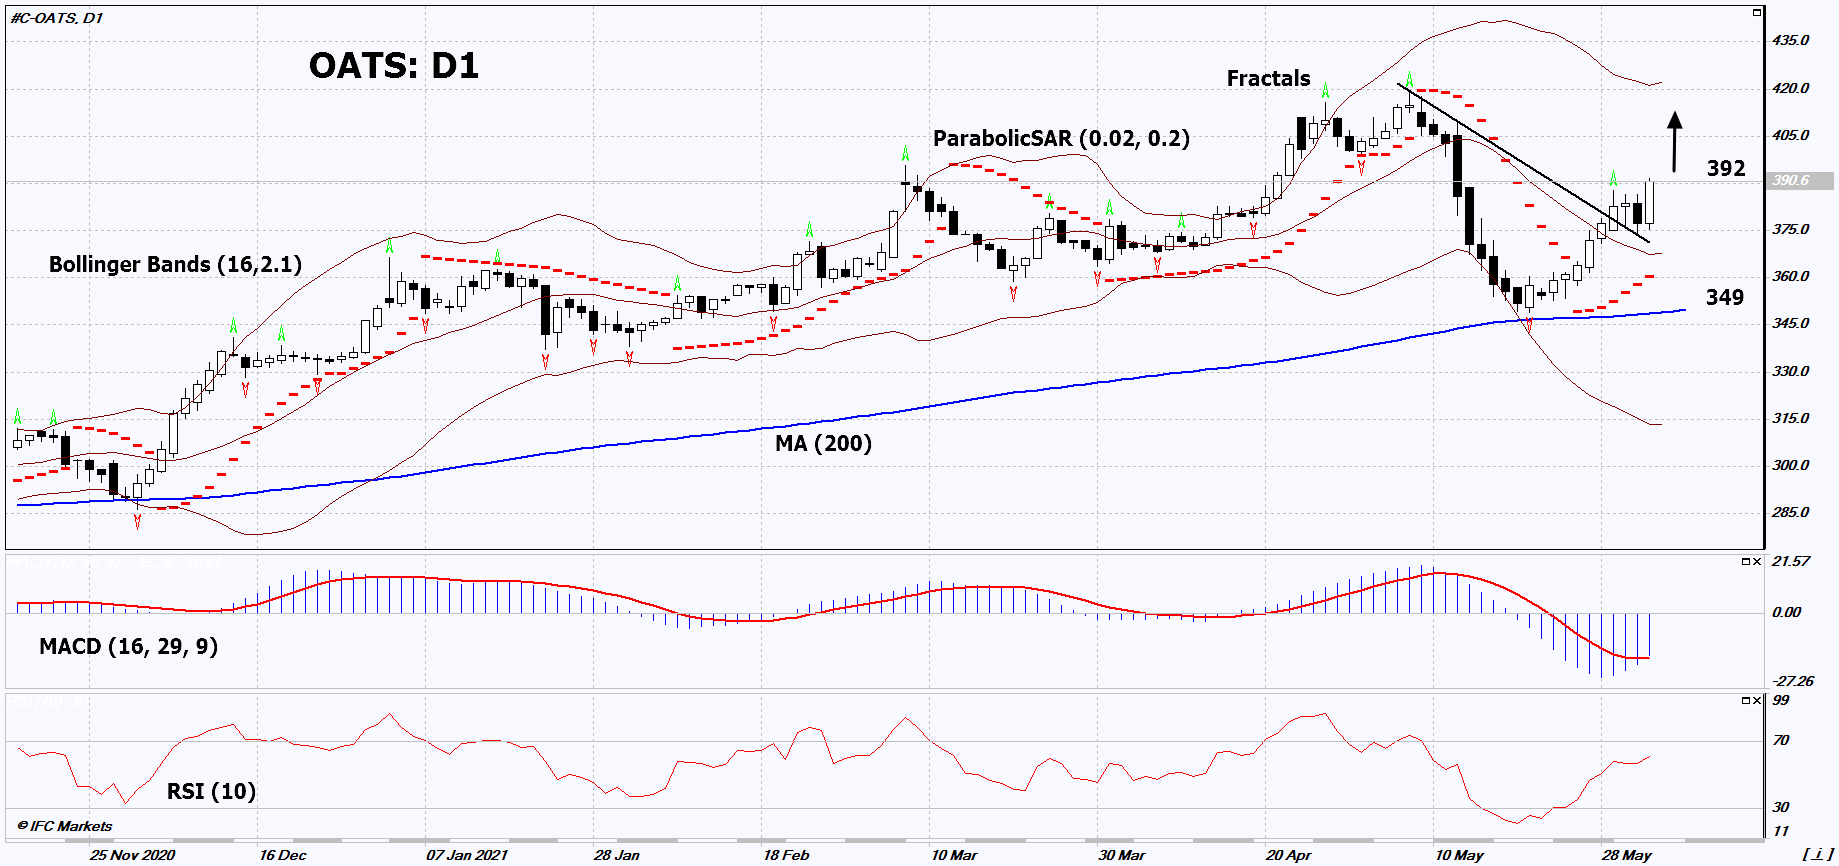
On the daily timeframe, OATS: D1 came out of the downtrend. A number of technical analysis indicators have generated signals for further growth. We do not rule out bullish movement if OATS rises above the last high: 392. This level can be used as an entry point. The initial risk limitation is possible below the Parabolic signal, the last lower fractal, and the 200-day moving average line: 349. After opening a pending order, move the stop following the Bollinger and Parabolic signals to the next fractal low. Thus, we change the potential profit/loss ratio in our favor. The most cautious traders, after making a deal, can go to the four-hour chart and set a stop-loss, moving it in the direction of movement. If the price overcomes the stop level (349) without activating the order (392), it is recommended to delete the order: there are internal changes in the market that were not taken into account.
Fundamental analysis
United States Department of Agriculture (USDA) has published an overview of the quality of its crops. Will the growth of OATS quotes continue? According to the USDA, the share of crops of high-quality oats (Good & Excellent) is now 55%. In the same period last year, the share of Good & Excellent crops was significantly higher and amounted to 71%. Remember that the area under oats in the United States in 2021 is 2.49 million acres. This is 17% less compared to 2020. A decline in the quality of crops and their area may contribute to an increase in oat prices. An additional positive factor for the prices of all grain crops in the United States may be the emerging drought.
Want to get more free analytics? Open Demo Account now to get daily news and analytical materials.
Want to get more free analytics? Open Demo Account now to get daily news and analytical materials.
Author

Dmitry Lukashov
IFC Markets
Dimtry Lukashov is the senior analyst of IFC Markets. He started his professional career in the financial market as a trader interested in stocks and obligations.


