Drought in India can reduce cotton harvest

The Cotton Association of India lowered its cotton production forecast for India in the agricultural season 2018/19 by 10.3%. Will the Cotton quotations continue growing?
In the last review of the Cotton Association of India, a cotton harvest of 31.2 million kip is predicted for June (approximately 218 kg in a bale). Whereas in its October review it was expected to produce 34.8 million bales. The reduction in cotton crop forecasts is caused by a severe drought in India. According to the India Meteorological Department, in the state of Gujarat - the main cotton producer in the country, the amount of precipitation is 47% lower than last year’s level. In general, in India, since the beginning of the monsoon season on June 1, precipitation is 19% less than last year. Another positive factor for quotes was the increase in exports of American cotton per week. This was reported by U.S. Agriculture Department. On July 30, in Shanghai, US Treasury Secretary Steven Mnuchin and sales representative Robert Lighthizer will hold talks with Chinese Vice Premier Liu He about lifting a number of trade restrictions and canceling duties. In particular, China’s purchases of American cotton may be increased.
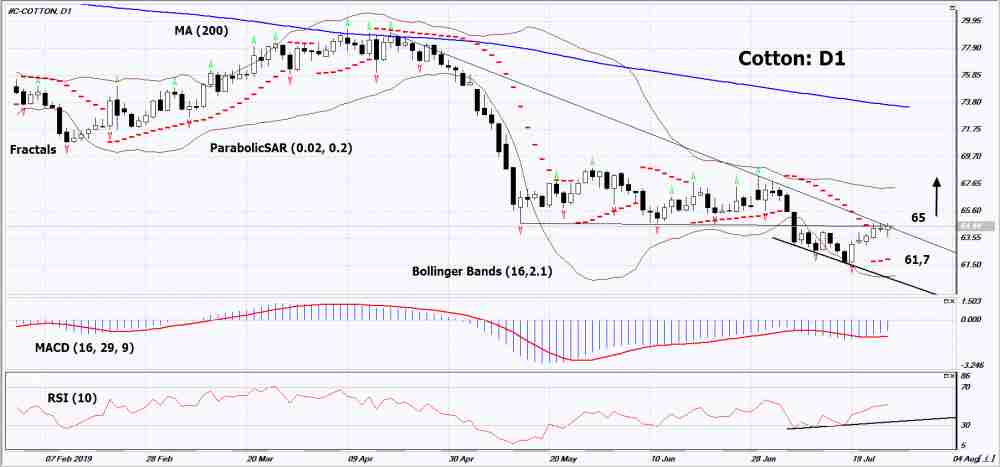
On the daily timeframeCotton: D1 to trying to break the downtrend upward. Various technical analysis indicators formed signals for improvement. Further growth of quotations is possible in case of an increase in global demand and deterioration of the weather in India.
- The Parabolic indicator shows a signal to increase.
- The Bolinger bands expanded, indicating a volatility increase . Both lines of Bollinger have a slope up.
- The RSI indicator is above the 50 mark. It has formed a divergence to increase.
- The MACD indicator gives a bullish signal.
The bullish momentum may develop if Cotton exceeds its last maximum: 65. This level can be used as an entry point. The initial stop lose may be placed below the last lower fractal, the Parabolic signal and a 3-year low: 61.7. After opening the pending order, stop shall be moved following the signals of Bollinger and Parabolic to the next fractal minimum. Thus, we are changing the potential profit/loss to the breakeven point. More risk-averse traders may switch to the 4-hour chart after the trade and place a stop loss moving it in the direction of the trade. If the price meets the stop level (61,7) without reaching the order (65), we recommend to cancel the order: the market sustains internal changes that were not taken into account.
Technical Analysis Summary
| Position | Buy |
| Buy stop | Above 65 |
| Stop loss | Below 61,7 |
Want to get more free analytics? Open Demo Account now to get daily news and analytical materials.
Author

Dmitry Lukashov
IFC Markets
Dimtry Lukashov is the senior analyst of IFC Markets. He started his professional career in the financial market as a trader interested in stocks and obligations.


