Technical Analysis #C-COTTON: 2019-02-26

Market participants hope that China will increase US cotton imports along with soybeans
Market participants hope that China will increase US cotton imports along with soybeans. Will Cotton prices rise?
US Secretary of Agriculture Sonny Perdue said that China agreed to buy an additional 10 million tons of US soybeans. The deal was discussed during the meeting of US President Donald Trump and Chinese Vice Premier Liu He. In the framework of trade negotiations, Donald Trump is also going to meet with Chinese President Xi Jinping. Meanwhile, it is known that China has agreed to purchase US agricultural products worth $30 billion. In the 2018/19 agricultural season, China reduced the purchase of cotton in the United States by 28 thousand bales. According to the USDA (US Department of Agriculture), the total volume of cotton exports from the United States has amounted to 977 thousand bales since the beginning of the season. Some investors were disappointed that it was less than the psychological level of 1 million bales. However, the USDA also noted a slight reduction in US cotton crops in the current season to 14.3 million acres, as well as its reserves by nearly 1% to 127.9 thousand bales (480 pounds).
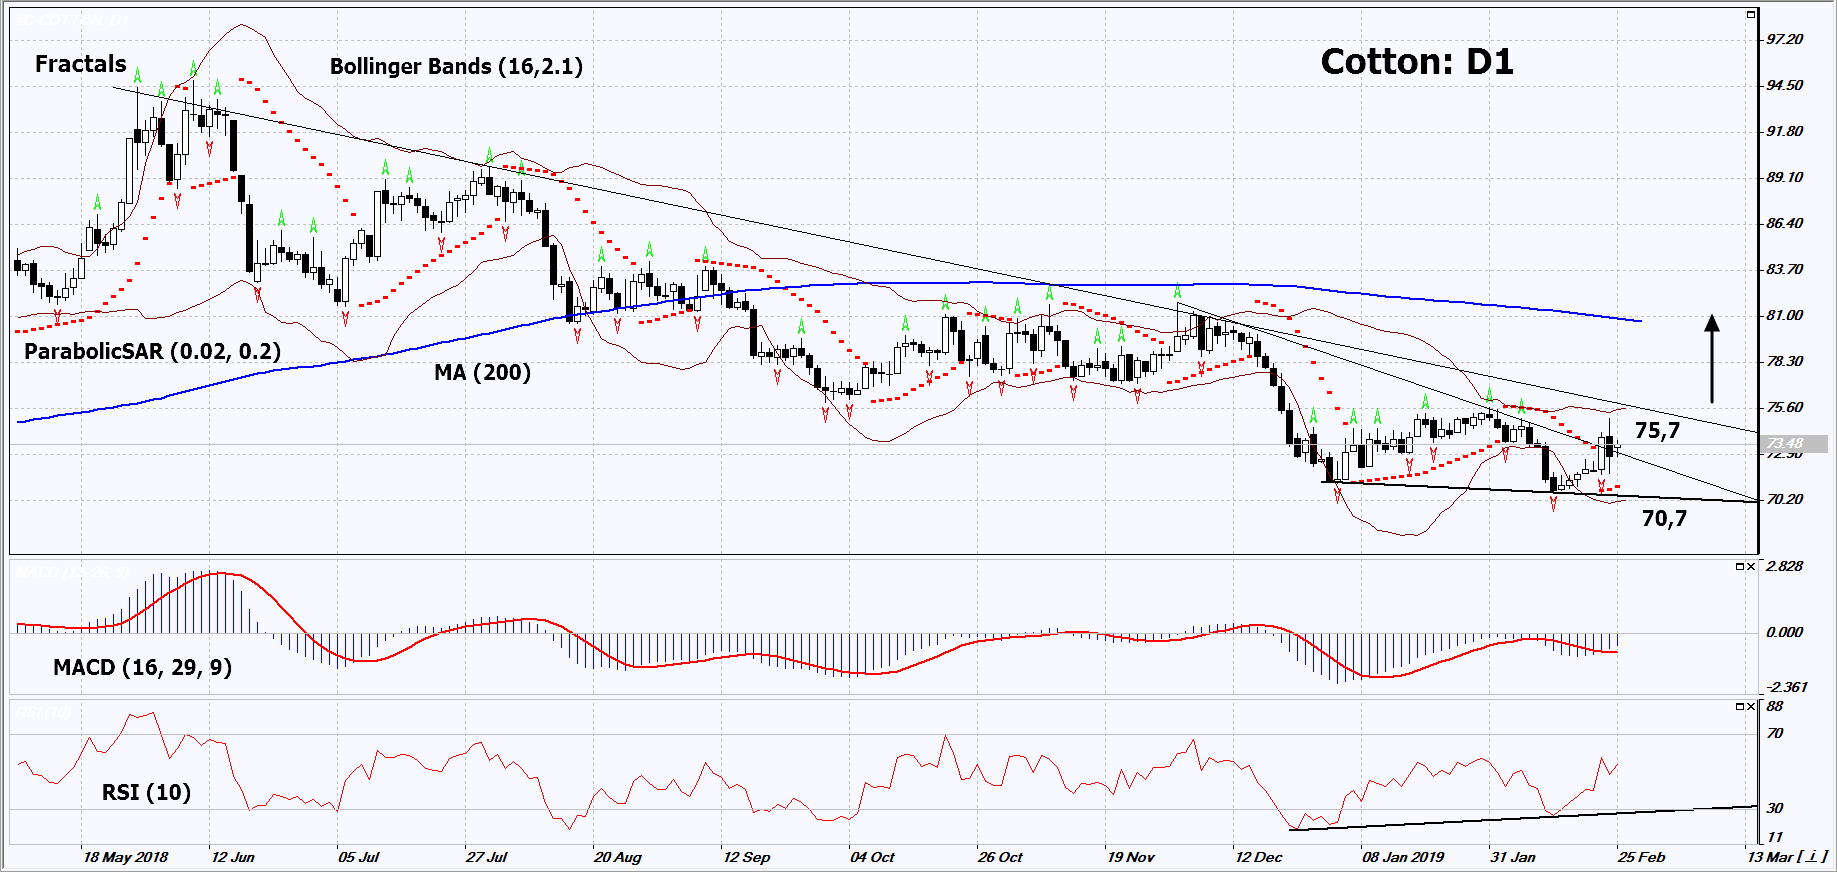
On the daily timeframe, Cotton: D1 has exited the triangle and turned upward. Before opening a buy position, it should overcome the resistance line of the downtrend. A number of technical analysis indicators formed buy signals. The further price growth is possible in case of increase in global demand.
-
The Parabolic Indicator gives a bullish signal.
-
The Bollinger bands have widened, which indicates high volatility. Both Bollinger bands are titled upward.
-
The RSI indicator is above 50. It has formed a positive divergence.
-
The MACD indicator gives a bullish signal.
The bullish momentum may develop in case Cotton exceeds the upper Bollinger band, its two last fractal highs and the resistance line of the downtrend at 75.7. This level may serve as an entry point. The initial stop loss may be placed below the two last fractal lows, the Parabolic signal, the low since November 2017 and the lower Bollinger band at 70.7. After opening the pending order, we shall move the stop to the next fractal low following the Bollinger and Parabolic signals. Thus, we are changing the potential profit/loss to the breakeven point. More risk-averse traders may switch to the 4-hour chart after the trade and place there a stop loss moving it in the direction of the trade. If the price meets the stop level (70.7) without reaching the order (75.7), we recommend to close the position: the market sustains internal changes that were not taken into account.
Summary of technical analysis
|
Position |
Buy |
|
Buy stop |
Above 75.7 |
|
Stop loss |
Below 70.7 |
Want to get more free analytics? Open Demo Account now to get daily news and analytical materials.
Want to get more free analytics? Open Demo Account now to get daily news and analytical materials.
Author

Dmitry Lukashov
IFC Markets
Dimtry Lukashov is the senior analyst of IFC Markets. He started his professional career in the financial market as a trader interested in stocks and obligations.


