Tariff Threats Spook Markets [Video]
![Tariff Threats Spook Markets [Video]](https://editorial.fxstreet.com/images/Markets/Currencies/Majors/DollarIndex/rows-of-dollars-bundles-background-19722556_XtraLarge.jpg)
US Dollar: June USD is Up at 96.630.
Energies: May '19 Crude is Up at 64.25.
Financials: The Jun 30 year bond is Up 2 ticks and trading at 148.02.
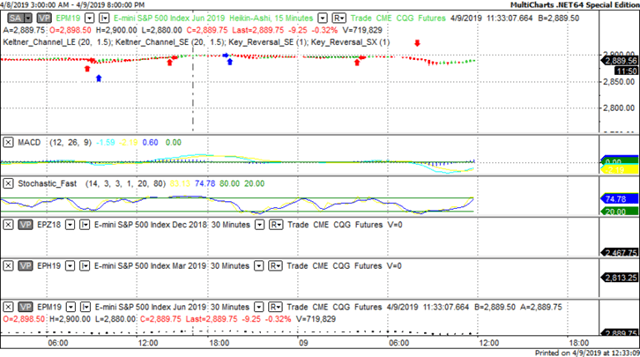
Indices: The June S&P 500 emini ES contract is 16 ticks Higher and trading at 2886.50.
Gold: The June Gold contract is trading Down at 1307.90 Gold is 4 ticks Lower than its close.
Initial Conclusion
This is not a correlated market. The dollar is Up+ and Crude is Up+ which is not normal and the 30 year Bond is trading Higher. The Financials should always correlate with the US dollar such that if the dollar is lower then bonds should follow and vice-versa. The S&P is Higher and Crude is trading Higher which is not correlated. Gold is trading Lower which is correlated with the US dollar trading Up. I tend to believe that Gold has an inverse relationship with the US Dollar as when the US Dollar is down, Gold tends to rise in value and vice-versa. Think of it as a seesaw, when one is up the other should be down. I point this out to you to make you aware that when we don't have a correlated market, it means something is wrong. As traders you need to be aware of this and proceed with your eyes wide open.
At this hour Asia is trading mainly Lower with the exception of the Shanghai and Singapore exchanges which are fractionally Higher. Currently all of Europe is trading Higher with the exception of the London exchange which is fractionally Lower.
Possible Challenges To Traders Today
-
CPI is out at 8:30 AM EST. This is major.
-
Core CPI is out at 8:30 AM EST. This is major.
-
Crude Oil Inventories is out at 10:30 AM EST. This is major.
-
FOMC Member Quarles Speaks at 11:50 AM EST. This is major.
-
10-y Bond Auction starts at 1 PM EST. Major
-
FOMC Meeting Minutes are released at 2 PM EST. This is major.
-
Federal Budget Balance is out at 2 PM EST. Major.
Treasuries
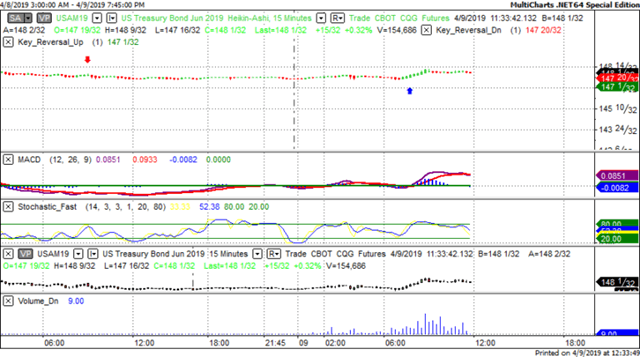
We've elected to switch gears a bit and show correlation between the 30 year bond (ZB) and The YM futures contract. The YM contract is the DJIA and the purpose is to show reverse correlation between the two instruments. Remember it's liken to a seesaw, when up goes up the other should go down and vice versa.
Yesterday the ZB made a major move at around 8 AM EST. The ZB hit a Low at around that time and the YM hit a High. If you look at the charts below ZB gave a signal at around 8 AM EST and the YM was moving Lower at the same time. Look at the charts below and you'll see a pattern for both assets. ZB hit a Low at around 8 AM and the YM was moving Lower at the same time. These charts represent the newest version of MultiCharts and I've changed the timeframe to a 15 minute chart to display better. This represented a Long opportunity on the 30 year bond, as a trader you could have netted about 20 ticks per contract on this trade. Each tick is worth $31.25. Please note: the front month for the ZB contract is now June, 2019
Charts Courtesy of MultiCharts built on an AMP platform.
Bias
Yesterday we gave the markets a Neutral bias as the indices didn't seem to have any sense of direction yesterday morning. The Dow dropped 190 points and the other indices lost ground as well. Today we aren't dealing with a correlated market and our bias is Neutral.
Could this change? Of Course. Remember anything can happen in a volatile market.
Commentary
Yesterday morning both the Asian and European markets were trading Lower and it became apparent that yesterday would be a challenging day. It didn't help when President Trump decided to issue a tweet warning potential tariffs of European goods. Doing this to China and Asia in general is one thing. The Chinese aren't thought of as high quality. Europe however is high quality. Does BMW, Mercedes Benz and LVMH ring a bell? When will this Chief Administrator learn that every vowel will be dissected? It's been two years already. So the market hears this and guess what? They run for cover.
Author

Nick Mastrandrea
Market Tea Leaves


