Take the ISM with a Grain of Salt
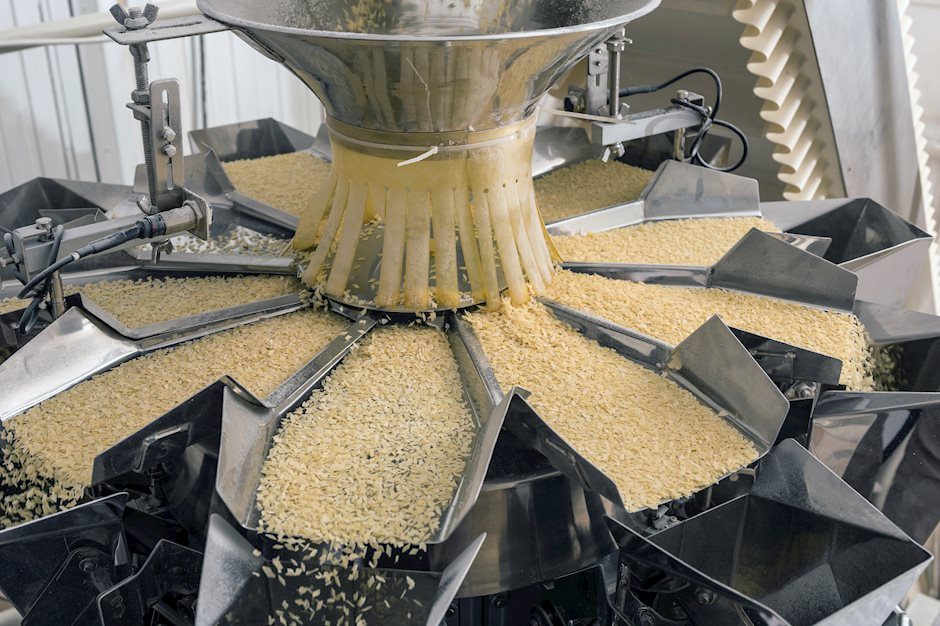
The 58.8 reading for ISM signals the fastest pace of manufacturing growth in six years. The factory sector is undoubtedly on an upswing, but August can be a head-fake. Watch for inventories to boost growth in H2.
After Lame Jobs Report, ISM Does Not Disappoint
After the dud employment report earlier this morning, the latest print for the ISM manufacturing index offers a little more excitement. Manufacturing activity in August rose to its highest level (58.8) since 2011, according to the Institute for Supply Management. Most months, the ISM release becomes available prior to the almighty jobs report, but when the stars align such that the first Friday of the month happens to fall on the 1st , the jobs number hits the wire an hour and a half before the ISM. That can matter because the employment component of the ISM can offer clues about the direction and magnitude of hiring. In this case, advance knowledge might not have helped. The consensus overshot the extent of job growth for August, but expectations might have been even greater if we had advance knowledge that the ISM would shoot higher and the employment component would soar to a six-year high of 59.9.
Admittedly, manufacturing jobs have gone 10 months without a decline and the 36,000 increase reported in August was the biggest monthly increase in four years. So, maybe this ISM report is not such a red herring after all. Remember What Kipling Said about Triumph and Disaster Before we get too far ahead of ourselves celebrating the great manufacturing renaissance, it bears noting that the August print for ISM last year was an aberration and this may be as well. August has proven to be a difficult month for seasonal adjustment at the Labor Department and perhaps the ISM has had similar issues. Last year in August the ISM suddenly and unexpectedly fell below 50, signaling contraction, but a month later the ISM jumped to 51.7 and has not returned to contraction territory since.
Tell Me an Inventory Story
As we wrote in a recent special report, “Inventories: The Tail That Wages the Dog in Q3?”, after an uncharacteristically calm stretch, inventory dynamics may play a big role in the third quarter. There are some clues in today’s ISM about the current state of inventory dynamics. In fact the two largest overall moves in the month were in the inventories component, which jumped 5.5 points, signaling the fastest pace of stockpiling in seven years and customer inventories, which dropped 8.0 points to 41.0 which suggests customer inventories are too low—the lowest in fact that we’ve seen in six years. The takeaway in our view is that there is a bulge getting ready to work its way through the supply chain and as that plays out we
expect inventories to be additive to topline GDP growth in the second half of 2017. Of course, Hurricane Harvey will introduce an additional degree of variability which we will be monitoring.
Author

Wells Fargo Research Team
Wells Fargo


