Stocks Fail to Hold Gains, But Still No Correction
The first part of yesterday's trading session was controlled by the bulls and the S&P 500 index was gaining ahead of the FOMC Minutes release at 2:00 p.m. Then the uptrend reversed and stocks fell below Tuesday's closing prices. Investors continued taking short-term profits off the table after week-long move up from previous Friday's lows. The market trades around 6% below its late January all-time high. Stocks are expected to open slightly higher today, but will they extend their yesterday's late session sell-off or bounce and continue trading within three-day-long consolidation?
The U.S stock market indexes lost 0.2-0.7% on Wednesday, as investors continued taking profits after week-long rally from February 9 lows. The S&P 500 index extended its short-term fluctuations along the level of 2,700-2,750. It retraced more than 61.8% of its late January - early February sell-off. However, it bounced off that resistance level again and reversed its intraday uptrend following the FOMC Minutes release at 2:00 p.m. The broad stock market index currently trades 6% below January 26 record high of 2,872.87. The Dow Jones Industrial Average lost 0.7%, and the technology Nasdaq Composite lost 0.2% on Wednesday.
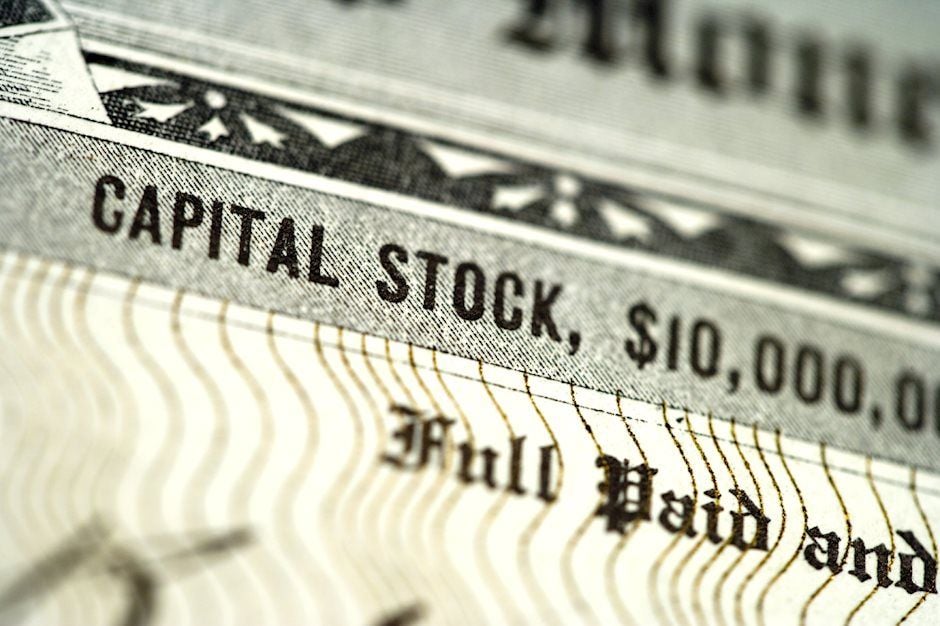
The nearest important level of resistance of the S&P 500 index remains at around 2,740-2,750, marked by 61.8% retracement of the whole move down from late January record high (2,742.92) and its Friday's local high. The resistance level is also at 2,760-2,765. On the other hand, support level is at 2,700, marked by recent local lows. If the market continues lower, potential support level would be at around 2,670.
The index reached its record high almost a month ago on January 26. It broke below month-long upward trend line, as it confirmed uptrend's reversal. Then the broad stock market gauge retraced all of its January rally and continued lower. The index extended its downtrend on February 9, as it was almost 12% below the late January record high. We can see that stocks reversed their medium-term upward course following whole retracement of last month's euphoria rally. However, the market bounced off its almost year-long medium-term upward trend line, and it retraced more than 61.8% of the sell-off within a few days of trading. Is this still just an upward correction or uptrend leading to new all-time highs? For now, it still looks like an upward correction:
Mixed Expectations
The index futures contracts are trading between 0.0 and +0.2% vs. their yesterday's closing prices right now. It means that investors' expectations ahead of the opening of today's trading session are virtually flat to slightly positive. The European stock market indexes have lost 0.4-0.9% so far. Will stocks continue their short-term move down? It's hard to say, because yesterday's closing price fell close to support level of 2,700. If it breaks lower, it could continue to the next support level of 2,670. Investors will now wait for some economic data announcements: Initial Claims at 8:30 a.m., Leading Indicators at 10:00 a.m., Crude Oil Inventories at 11:00 a.m.
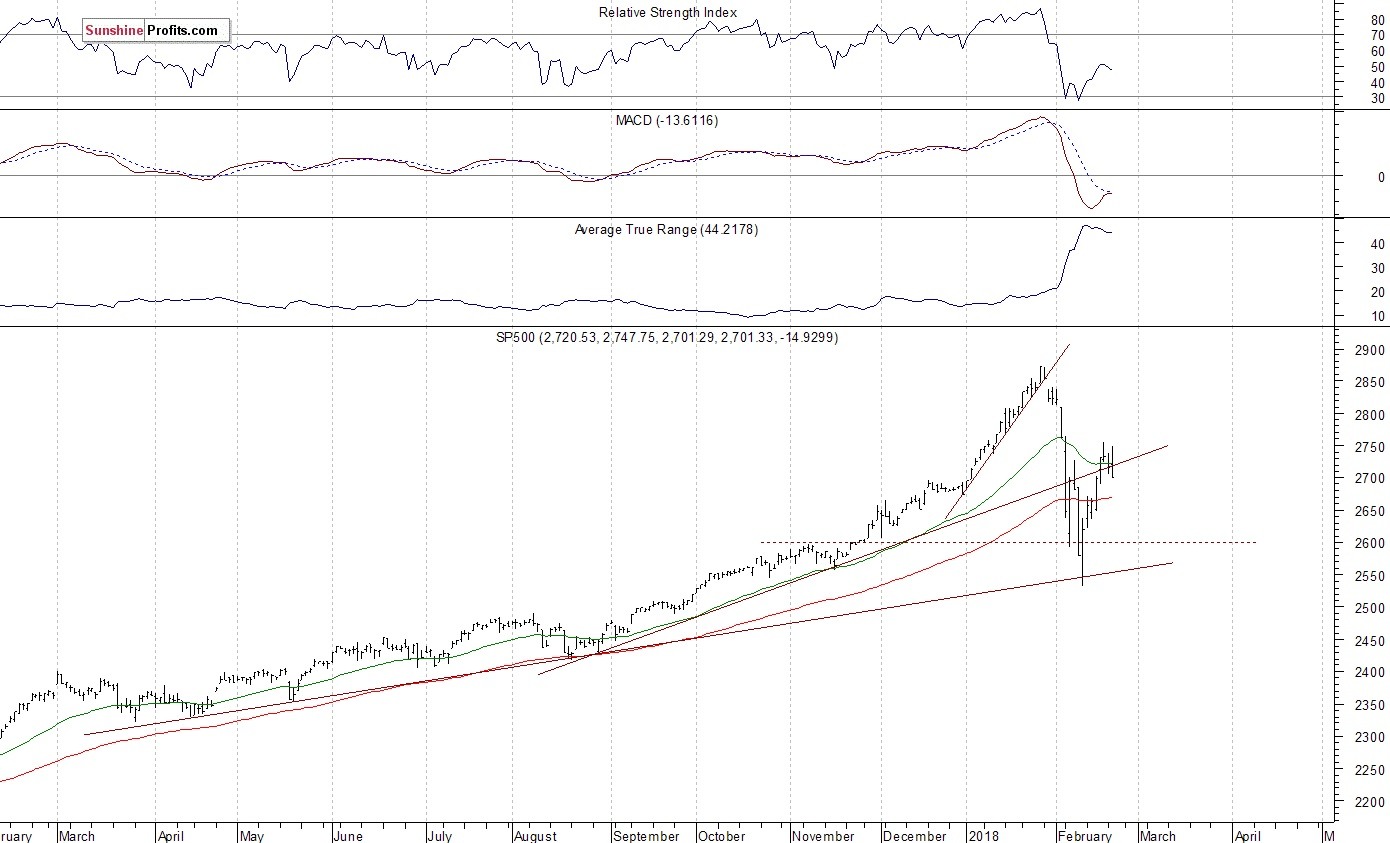
The S&P 500 futures contract trades within an intraday uptrend, as it retraces some of its yesterday's move down. The market bounced off support level at around 2,680, then it broke above 2,700 mark. Potential level of resistance is at around 2,720. The main short-term resistance level is at 2,740-2,750, marked by recent local highs. The futures contract is slightly rebounding, as we can see on the 15-minute chart:
Nasdaq Within Short-Term Consolidation
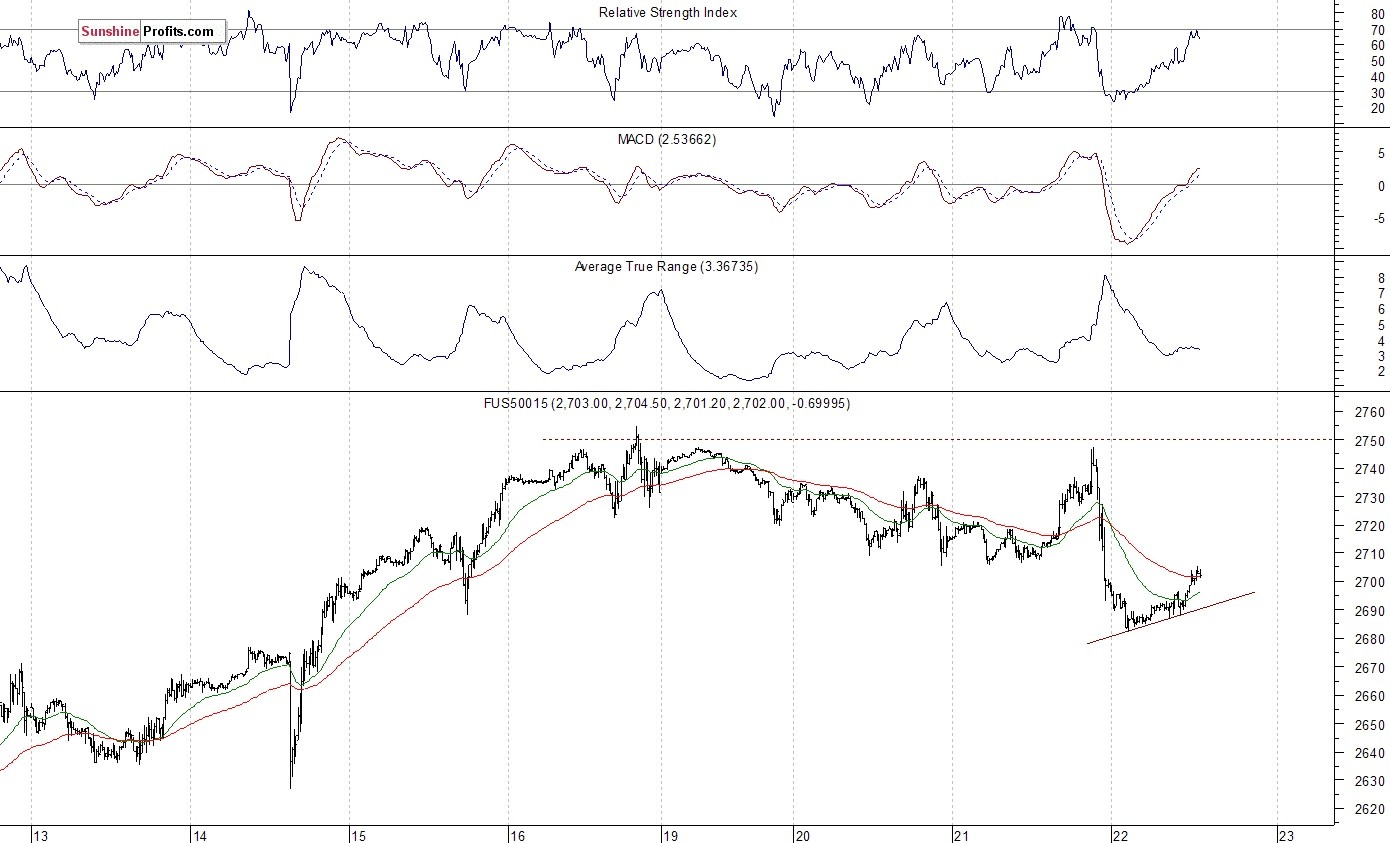
The technology Nasdaq 100 futures contract follows a similar path, as it trades within an intraday uptrend. The market retraces some of its its yesterday's move down following bounce off support level at around 6,700. It is almost a week-long consolidation along the level of 6,700-6,850. For now, it is just relatively flat correction within an uptrend from February 9 low. But will technology index get back above 7,000 mark and continue towards new record highs? The Nasdaq futures contract extends its short-term consolidation this morning, as the 15-minute chart shows:
Apple Fails at Resistance, Amazon Reaches New Record
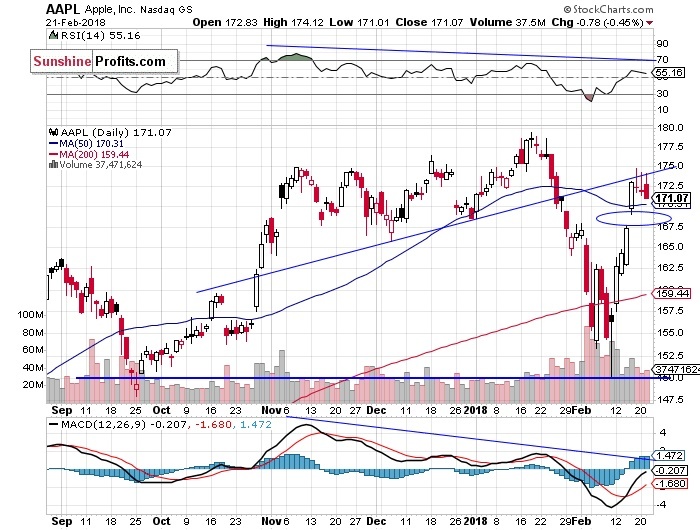
Let's take a look at Apple, Inc. stock (AAPL) daily chart (chart courtesy of http://stockcharts.com). It was one of the recent stock market rout's main drivers. Then it led last week's broad stock market rebound rally. The stock failed to continue higher a month ago and consequently, it retraced its January advance and continued much lower. It fell close to support level of $150 on Friday February 9. Since then, it traded within a relatively strong uptrend, but it failed to break above the resistance level of $175-180 a week ago on Friday. The market reached its previously broken upward trend line. It looks like some short-term topping pattern:
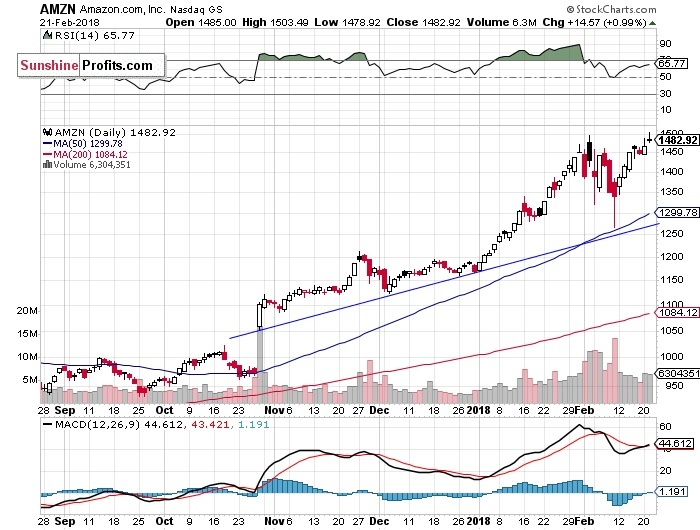
Amazon.com, Inc. stock (AMZN) continues to be relatively strong vs. the broad stock market. Despite an overall weakness, it reached new record high yesterday above $1,500 mark. However, it reversed its upward course and closed more than 20 dollars below new record high of $1,503.49. The stock continues to trade well above its end of year closing price of $1,167.5. AMZN bounced off its upward trend line two weeks ago, following downward correction below the price of $1300. Despite new record high, we still can see potential bearish double top pattern:
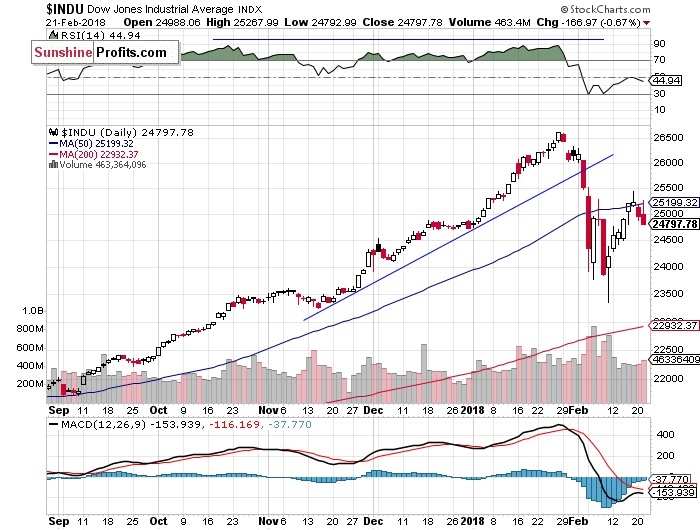
The Dow Jones Industrial Average daily chart shows that blue-chip index broke below its short-term consolidation three weeks ago. The price sharply accelerated its downtrend, as it broke below the level of 26,000 and continued much lower. There were some medium-term negative technical divergences - the most common divergences are between asset’s price and some indicator based on it (for instance the index and RSI based on the index). In this case, the divergence occurs when price forms a higher high and the indicator forms a lower high. It shows us that even though price reaches new highs, the fuel for the uptrend starts running low.
The DJIA fell below 23,500 on Friday two weeks ago. We saw positive candlestick chart pattern that day. The market formed bullish harami. It is a pattern in which a large black candlestick is followed by a smaller white candlestick with body located within the body of a preceding day. Since then, it continued higher. The market bounced off resistance level at around 25,500 on Friday. The index extends its short-term downward correction:
Concluding, the S&P 500 index lost 0.6% on Wednesday, as it continued its short-term downtrend despite opening higher and retracing some of its recent decline in the first part of the trading session. The broad stock market rally failed to continue at 61.8% retracement of the late January - early February sell-off again. So, is it just quick downward correction before another leg higher or some new downtrend leading to February 9 low or lower? It's hard to say, but we may see some more downward pressure in the near future. Especially if the index breaks below 2,700 mark. Stocks are expected to open virtually flat today, and they will probably retrace some more of their week-long rally.
The broad stock market was falling almost 12% off its late January record high on Friday, February 9 before an intraday reversal. It was a final panic selling ahead of short-term upward reversal, and the market found a support of its medium-term upward trend line, which was at 2,550. The index extended its week-long rebound almost a week ago on Friday, but it failed to continue above 61.8% retracement of the sell-off.
The broad stock market retraced its whole month-long January rally and continued lower, the lowest since early October. So, medium-term picture is now bearish. Investors took profits off the table following the unprecedented month-long rally, but then they began selling in panic. It was quite similar to 2010 Flash Crash event. Is this just downward correction or the beginning of a new medium-term downtrend? This sell-off set the negative tone for weeks or months to come.
Want free follow-ups to the above article and details not available to 99%+ investors? Sign up to our free newsletter today!
Author

Paul Rejczak
Sunshine Profits
Paul Rejczak is a stock market strategist who has been known for the quality of his technical and fundamental analysis since the late nineties.


