Still no resolution on the debt ceiling – Are Biden and McCartney closer to reaching an agreement?

USD: Jun '23 is Down at 103.990.
Energies: Jul '23 Crude is Up at 72.36.
Financials: The Jun '23 30 Year T-Bond is Up 9 ticks and trading at 125.26.
Indices: The Jun '23 S&P 500 emini ES contract is 26 ticks Lower and trading at 4153.25.
Gold: The Jun'23 Gold contract is trading Up at 1953.50. Gold is 98 ticks Higher than its close.
Initial conclusion
This is not a correlated market. The USD is Down, Crude is Up which is normal, but the 30 Year T-Bond is trading Higher. The Financials should always correlate with the US dollar such that if the dollar is Higher, then the bonds should follow and vice-versa. The S&P is Lower, and Crude is trading Higher which is correlated. Gold is trading Higher which is correlated with the US dollar trading Down. I tend to believe that Gold has an inverse relationship with the US Dollar as when the US Dollar is down, Gold tends to rise in value and vice-versa. Think of it as a seesaw, when one is up the other should be down. I point this out to you to make you aware that when we don't have a correlated market, it means something is wrong. As traders you need to be aware of this and proceed with your eyes wide open. At the present time Asia is trading mainly Higher with the exception of the Hang Seng and Indian Singapore exchanges which are trading Lower. All of Europe is trading Lower at the present time.
Possible challenges to traders today
-
Core PCE Price Index m/m is out at 8:30 AM EST. This is Major.
-
Core Durable Goods Orders m/m is out at 8:30 AM EST. This is Major.
-
Durable Goods Orders m/m are out at 8:30 AM EST. This is Major.
-
Goods Trade Balance is out at 8:30 AM EST. This is Major.
-
Personal Income m/m is out at 8:30 AM EST. This is Major.
-
Personal Spending m/m is out at 8:30 AM EST. This is Major.
-
Prelim Wholesale Inventories m/m is out at 8:30 AM. This is Major.
-
Revised UoM Consumer Sentiment is out at 10 AM EST. This is Not Major.
-
Revised UoM Inflation Expectations is out at 10 AM EST. This is not Major.
Treasuries
Traders, please note that we've changed the Bond instrument from the 30 year (ZB) to the 10 year (ZN). They work exactly the same.
We've elected to switch gears a bit and show correlation between the 10-year bond (ZN) and the S&P futures contract. The S&P contract is the Standard and Poor's, and the purpose is to show reverse correlation between the two instruments. Remember it's likened to a seesaw, when up goes up the other should go down and vice versa.
Yesterday the ZN migrated Lower at around 10:15 PM EST as the S&P hit a Low at around the same time. If you look at the charts below the ZN gave a signal at around 10:15 PM and the ZN continued its Downward trend. Look at the charts below and you'll see a pattern for both assets. S&P hit a Low at around 10:15 PM and migrated Higher. These charts represent the newest version of MultiCharts and I've changed the timeframe to a 15-minute chart to display better. This represented a Short opportunity on the 10-year note, as a trader you could have netted about 20 ticks per contract on this trade. Each tick is worth $15.625. Please note: the front month for the ZN is now Jun '23. The S&P contract is also Jun' 23. I've changed the format to filled Candlesticks (not hollow) such that it may be more apparent and visible.
Charts courtesy of MultiCharts built on an AMP platform
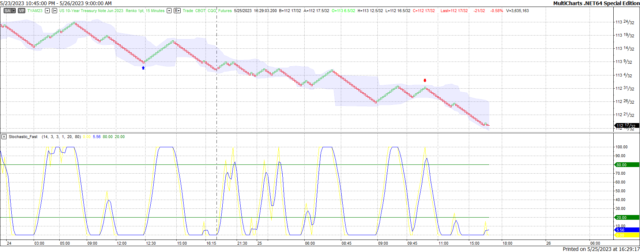
ZN - Jun 2023 - 5/25/23
-638206968838800573.png)
S&P - Jun 2023 - 5/25/23
Bias
Yesterday we gave the markets an Upside bias as both the USD and the Bonds were trading Lower and that usually reflects an Up day. The markets traded Mixed as the Dow dropped 35 points but the other indices did trade to the Upside. Today we aren't dealing with a correlated market and our bias is Neutral or Mixed.
Could this change? Of Course. Remember anything can happen in a volatile market.
Commentary
Still no resolution on the Debt Ceiling even though both Biden and McCartney have said that they're getting closer to an agreement. However there still is no agreement and we are less than a week away from June 1st when according to Secretary Yellen the US may default on its obligations and that is the first time in our history when something like that occurred. Today we have 9 economic reports, so we are saving it all before the Memorial Day weekend and on that note we wish all of you a safe and happy holiday. If you know of a veteran, give them thanks for their service. They have bought the peace that we enjoy.
Author

Nick Mastrandrea
Market Tea Leaves


