GBP/USD approaches local high, bolstered by BoE stance

The GBP/USD pair advanced to 1.3367 on Thursday, stabilising near its highest level since 22 October. Sterling is drawing support from a confluence of factors: a broadly weaker US dollar and a market reassessment that has scaled back expectations for additional Bank of England (BoE) monetary easing in 2026.
This follows yesterday’s Federal Reserve meeting, where the US central bank delivered a widely anticipated 25-basis-point rate cut. Crucially, the Fed signalled a potential pause in its easing cycle as early as January, emphasising the need for more economic data before determining the next steps.
Expectations for the BoE’s meeting next week remain firmly anchored. The market continues to price in an 84% probability of a 25-basis-point cut, largely overlooking recent data showing accelerating wage growth and persistent inflationary pressures. Furthermore, investors are almost fully pricing in a second rate cut by June, with a 75% chance assigned to an initial move as soon as April.
Market focus now shifts to the UK’s monthly GDP report, due on Friday, which could prompt a final adjustment to monetary policy expectations ahead of the BoE decision.
Technical analysis: GBP/USD
Four-hour chart
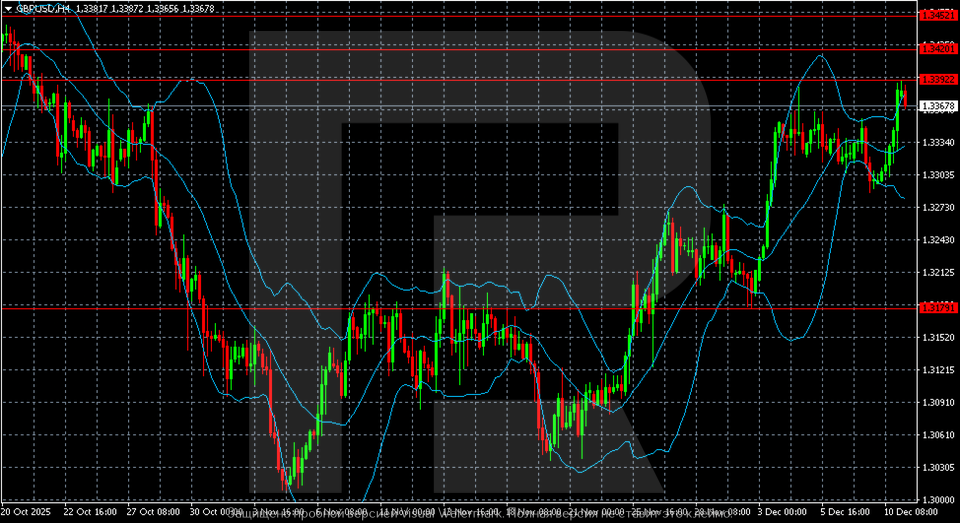
On the H4 chart, GBP/USD exhibits a strong upward bias, trading just below the key technical resistance at 1.3392. The pair’s position firmly above the middle Bollinger Band confirms the dominance of buyers. The expansion of the upper band signals rising volatility and suggests the market is building momentum for another attempt to breach this barrier.
A decisive breakout and close above 1.3392 would be a significant bullish development, opening the path towards the next resistance zone of 1.3420–1.3452. Should a reversal occur, the nearest notable support is at 1.3280. A breach of this level would indicate a deeper corrective phase, likely targeting the lower Bollinger Band.
One-hour chart
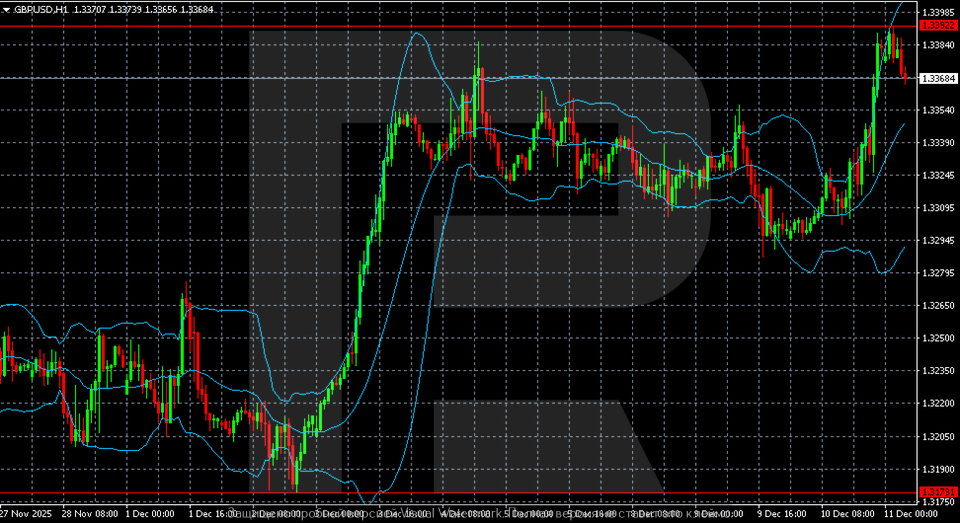
On the H1 chart, the pair is undergoing a near-term correction following its impulsive rise to the 1.3390–1.3392 resistance zone. It is currently finding support above 1.3360, a level from which a prior recovery originated.
The upper Bollinger Band has flattened after a period of sharp expansion, indicating short-term overbought conditions and increasing the likelihood of a consolidation or shallow pullback. Despite this, the overall H1 structure remains bullish, with the price above the middle band and the lower band providing dynamic support.
A sustained break above 1.3392 would signal a resumption of the uptrend, targeting 1.3420 and potentially 1.3450. Conversely, a loss of the 1.3360 support would be the first technical sign of weakening bullish momentum, potentially triggering a correction towards the next demand zone in the 1.3300–1.3280 range.
Conclusion
GBP/USD is trading with conviction, supported by shifting central-bank dynamics that have turned modestly in sterling’s favour. The technical setup is bullish but faces a critical test at the 1.3392 resistance level. A successful breakout would validate the strength of the current move, while a rejection could see the pair retreat to consolidate recent gains. The upcoming UK GDP data will provide the final fundamental cue before the highly anticipated BoE meeting next week.
Author

RoboForex Analysis Department
RoboForex
RoboForex Analysis Department provides timely market insights, expert technical analysis, and actionable forecasts across forex, commodities, indices, and equities.
















