State of the Union [Video]
![State of the Union [Video]](https://editorial.fxstreet.com/images/Markets/Currencies/Majors/DollarIndex/money-gm95713421-2487488_XtraLarge.jpg)
US Dollar: March USD is Up at 95.705.
Energies: March '19 Crude is Down at 54.43.
Financials: The Mar 30 year bond is Down 7 ticks and trading at 145.01.
Indices: The Mar S&P 500 emini ES contract is 2 ticks Higher and trading at 2721.75.
Gold: The Feb Gold contract is trading Down at 1316.20. Gold is 31 ticks Lower than its close.
Initial Conclusion
This is not a correlated market. The dollar is Up+ and Crude is Down- which is normal but the 30 year Bond is trading Lower. The Financials should always correlate with the US dollar such that if the dollar is lower then bonds should follow and vice-versa. The S&P is Higher and Crude is trading Lower which is correlated. Gold is trading Lower which is correlated with the US dollar trading Higher. I tend to believe that Gold has an inverse relationship with the US Dollar as when the US Dollar is down, Gold tends to rise in value and vice-versa. Think of it as a seesaw, when one is up the other should be down. I point this out to you to make you aware that when we don't have a correlated market, it means something is wrong. As traders you need to be aware of this and proceed with your eyes wide open.
At this hour Asia is trading Higher with the exception of the Nikkei and Singapore exchanges which are trading Lower at this time. Currently all of Europe is trading Higher at this time..
Possible Challenges To Traders Today
-
Final Services PMI is out at 9:45 AM EST. This is major.
-
ISM Non-Manufacturing PMI is out at 10 AM EST. This is major.
-
IBD/TIPP Economic Optimism - tentative. This is major.
Treasuries
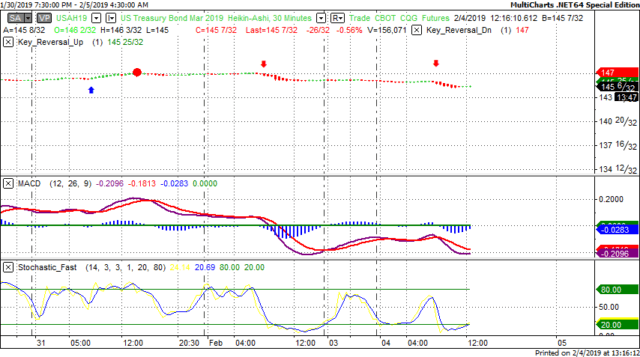
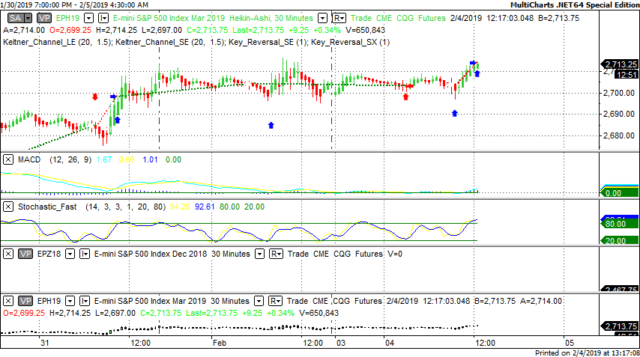
We've elected to switch gears a bit and show correlation between the 30 year bond (ZB) and The YM futures contract. The YM contract is the DJIA and the purpose is to show reverse correlation between the two instruments. Remember it's liken to a seesaw, when up goes up the other should go down and vice versa.
Yesterday the ZB made a major move at around 8 AM EST. The ZB hit a High at around that time and the YM hit a Low. If you look at the charts below ZB gave a signal at around 8 AM EST and the YM was moving Higher at the same time. Look at the charts below and you'll see a pattern for both assets. ZB hit a High at around 8 AM and the YM was moving Higher at the same time. These charts represent the newest version of MultiCharts and I've changed the timeframe to a 30 minute chart to display better. This represented a Shorting opportunity on the 30 year bond, as a trader you could have netted about 20 ticks per contract on this trade. Each tick is worth $31.25. Please note: the front month for the ZB contract is now March, 2019
Charts Courtesy of MultiCharts built on an AMP platform.
Bias
Yesterday we gave the markets a Neutral bias as the indices didn't seem to have much in the way of correlation and direction yesterday morning. Today we aren't dealing with a correlated market and our bias is Neutral.
Could this change? Of Course. Remember anything can happen in a volatile market.
Commentary
Yesterday the markets didn't seem to have much in the way of trend or direction in the AM. Whereas there wasn't anything in the way of economic news to drive the markets higher, they rose anyway. The Dow gained 175 points and the other indices gained ground as well. Today we suspect that the markets will be on the alert to see if any news will be forthcoming from DC given that the State of the Union address will be delivered later this evening. I have no doubt that the talk will be around the shutdown and the border wall but I wonder if there will be major finger pointing. I suspect yes but only time will tell....
Author

Nick Mastrandrea
Market Tea Leaves


