State of the Union Aftermath

Good Morning Traders,
As of this writing 5 AM EST, here's what we see:
US Dollar: March USD is Up at 95.910.
Energies: March '19 Crude is Down at 53.14.
Financials: The Mar 30 year bond is Up 9 ticks and trading at 145.31.
Indices: The Mar S&P 500 emini ES contract is 20 ticks Lower and trading at 2727.00.
Gold: The Feb Gold contract is trading Down at 1317.80. Gold is 15 ticks Lower than its close.
Initial Conclusion
This is not a correlated market. The dollar is Up+ and Crude is Down- which is normal and the 30 year Bond is trading Higher. The Financials should always correlate with the US dollar such that if the dollar is lower then bonds should follow and vice-versa. The S&P is Lower and Crude is trading Lower which is not correlated. Gold is trading Lower which is correlated with the US dollar trading Higher. I tend to believe that Gold has an inverse relationship with the US Dollar as when the US Dollar is down, Gold tends to rise in value and vice-versa. Think of it as a seesaw, when one is up the other should be down. I point this out to you to make you aware that when we don't have a correlated market, it means something is wrong. As traders you need to be aware of this and proceed with your eyes wide open.
At this hour Asia is trading Higher with the exception of the Aussie and Singapore exchanges which are trading Lower at this time. Currently all of Europe is trading Lower at this time..
Possible Challenges To Traders Today
-
Prelim Nonfarm Productivity is out at 8:30 AM EST. This is major.
-
Prelim Unit Labor Costs is out at 8:30 AM EST. This is major.
-
Trade Balance is out at 8:30 AM EST. This is major.
-
Crude Oil Inventories is out at 10:30 AM EST. This is major.
-
10-y Bond Auction starts at 1 PM EST. Major.
Treasuries
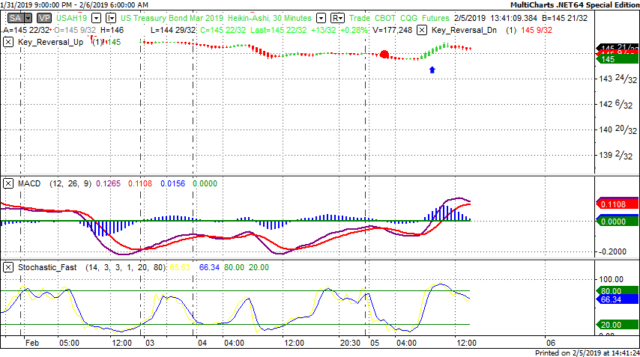
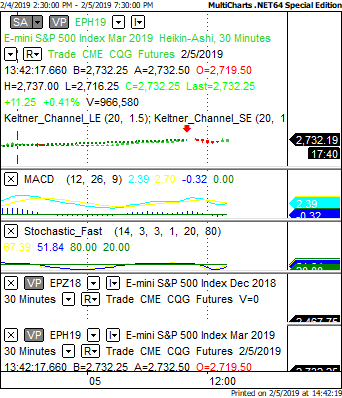
We've elected to switch gears a bit and show correlation between the 30 year bond (ZB) and The YM futures contract. The YM contract is the DJIA and the purpose is to show reverse correlation between the two instruments. Remember it's liken to a seesaw, when up goes up the other should go down and vice versa.
Yesterday the ZB made a major move at around 9 AM EST. The ZB hit a Low at around that time and the YM hit a High. If you look at the charts below ZB gave a signal at around 9 AM EST and the YM was moving Lower at the same time. Look at the charts below and you'll see a pattern for both assets. ZB hit a Low at around 9 AM and the YM was moving Lower at the same time. These charts represent the newest version of MultiCharts and I've changed the timeframe to a 30 minute chart to display better. This represented a Long opportunity on the 30 year bond, as a trader you could have netted about 20 ticks per contract on this trade. Each tick is worth $31.25. Please note: the front month for the ZB contract is now March, 2019
Charts Courtesy of MultiCharts built on an AMP platform
Bias
Yesterday we gave the markets a Neutral bias as the indices didn't seem to have much in the way of correlation or direction yesterday morning. The Dow rose by 172 points and the other indices rose as well. Today we aren't dealing with a correlated market and our bias is to the Downside.
Could this change? Of Course. Remember anything can happen in a volatile market.
Commentary
Yesterday the markets seemed to be floundering between positive and negative territory as we suspect everyone was awaiting some clue or insight as to the State of the Union address. No doubt there'll be a lot of blame game and finger pointing. The President will probably blame all the woes of the world on the Democrats and certainly the Democrats will respond in their rebuttal. What DC doesn't seem to understand is that We the People are the ones who suffer unless they start working together.
As a follow up to the above, President Trump actually appeared presidential during the State of the Union address. He did not call for an emergency regarding the wall with Mexico, as many thought he might. He was also (in my opinion) tame on his criticism of the Democrats.
Author

Nick Mastrandrea
Market Tea Leaves


