|

SP500: Buyers to expect a bullish breakout

The U.S. S&P 500 Index, in its 2-hourly chart, shows the progress in a consolidation structure as a wave ((ii)) of Minute degree labeled in black.

SP500

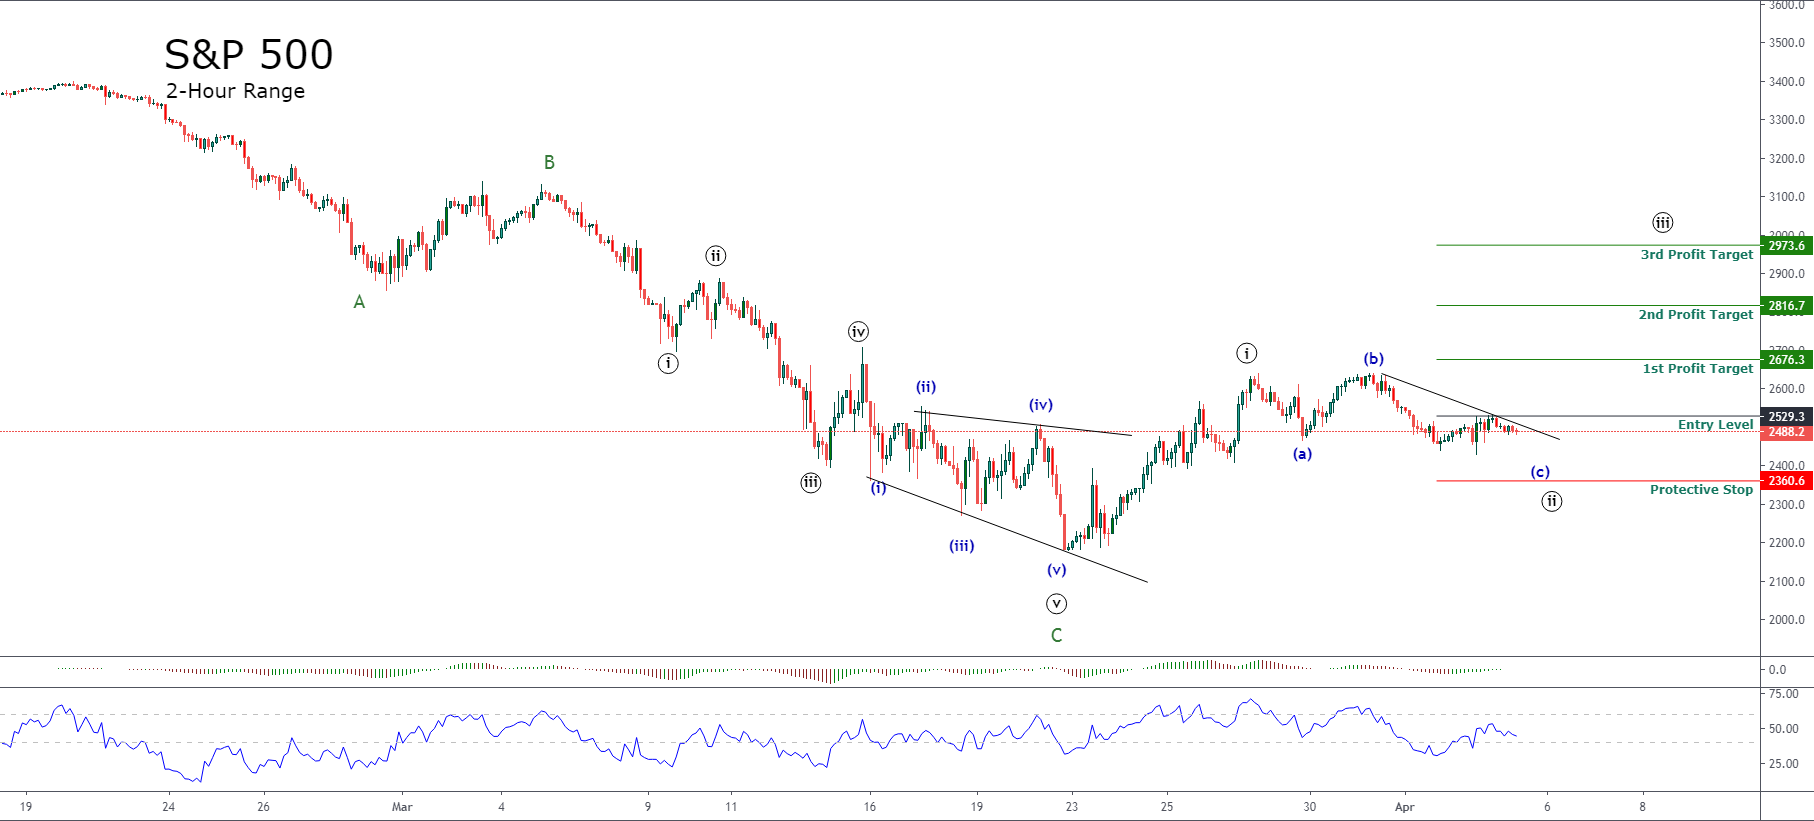
The internal sequence of the second wave of the upward cycle that began last March 22nd looks like an incomplete flat pattern. In particular, the flat pattern shows the advancement in the wave (c) of the Minuette degree labeled in blue.

At the same time, we observe that the internal structure of the wave (c) remains in the bearish side while its short-term trendline remains intact. However, the big picture reveals the possibility of a new ascent that may correspond to a wave ((iii)) of Minute degree in black.

A bullish position will activate if the price breaks out the descending trendline and closes above 2,529.3 pts. Our conservative scenario foresees a potential first target at 2,676.3 pts. If the bullishness of traders increases its upward momentum, the S&P 500 could advance to 2,816.7 pts, and even rise until 2,973.6 pts.

The level that invalidates our bullish scenario locates at 2,360.6 pts.

Trading Plan Summary

Entry Level: 2,529.3 pts.

Protective Stop: 2,360.6 pts.

1st Profit Target: 2,676.3 pts.

2nd Profit Target: 2,816.7 pts.

3rd Profit Target: 2,973.6 pts.


Try Secure Leveraged Trading with EagleFX!

Author

EagleFX Team

EagleFX Team is an international group of market analysts with skills in fundamental and technical analysis, applying several methods to assess the state and likelihood of price movements on Forex, Commodities, Indices, Metals and

More from EagleFX Team
Share:

Editor's Picks

EUR/USD recedes to daily lows near 1.1850

EUR/USD keeps its bearish momentum well in place, slipping back to the area of 1.1850 to hit daily lows on Monday. The pair’s continuation of the leg lower comes amid decent gains in the US Dollar in a context of scarce volatility and thin trade conditions due to the inactivity in the US markets.

GBP/USD flat lines near 1.3650 ahead of UK and US data

GBP/USD kicks off a new week on a subdued note and oscillates in a narrow range near 1.3650 on Monday. The mixed fundamental backdrop warrants some caution for aggressive traders as the market focus now shifts to this week's important data releases from the UK and the US.

Gold corrects lower, tries to stabilize above $5,000

Gold started the week under bearish pressure and declined to the $4,960 area before staging a modest rebound. As trading volumes remain thin with the US financial markets remaining closed on Presidents' Day holiday, XAU/USD looks to stabilize above $5,000 ahead of this week's key data releases.

Bitcoin consolidates as on-chain data show mixed signals

Bitcoin price has consolidated between $65,700 and $72,000 over the past nine days, with no clear directional bias. US-listed spot ETFs recorded a $359.91 million weekly outflow, marking the fourth consecutive week of withdrawals.

The week ahead: Key inflation readings and why the AI trade could be overdone

It is likely to be a quiet start to the week, with US markets closed on Monday for Presidents Day. European markets are higher across the board and gold is clinging to the $5,000 level after the tamer than expected CPI report in the US reduced haven flows to precious metals.

Monero Price Forecast: XMR risks a drop below $300 under mounting bearish pressure

Monero (XMR) starts the week under pressure, recording a 4% decline at press time on Monday after a 7% drop the previous day, putting the $300 support zone in focus.