SP500: a possible change in trend near October 9-23

SP500
The last Primary cycle low was August 21st, the day of the Total Solar Eclipse. The energy of the eclipse of this ellipse is still being felt. First from Harvey, Irma and then an 8.1 then a 7.1 earthquake in Mexico. Now possible volcanic activity in Bali.
We are now 7th week along and looking for a pullback into the nominal 6-week cycle low. This could extend into a nominal 9 ½ week sub-cycle but I think not. I’m looking for the market to pull back next week. but I’m not looking for a crash.
Note this last Primary cycle low was not very deep. Price was below the 15 and 45-day SMA and the 15-day dipped below the 45-day SMA.
The following daily chart of the SP500 shows the Geocentric Bradley indicator (thick red line). It indicates a possible change in trend near October 9-23. Look for surprise events. The rules for reading the Bradley indicator are in Section 9 of the subscriber's report.
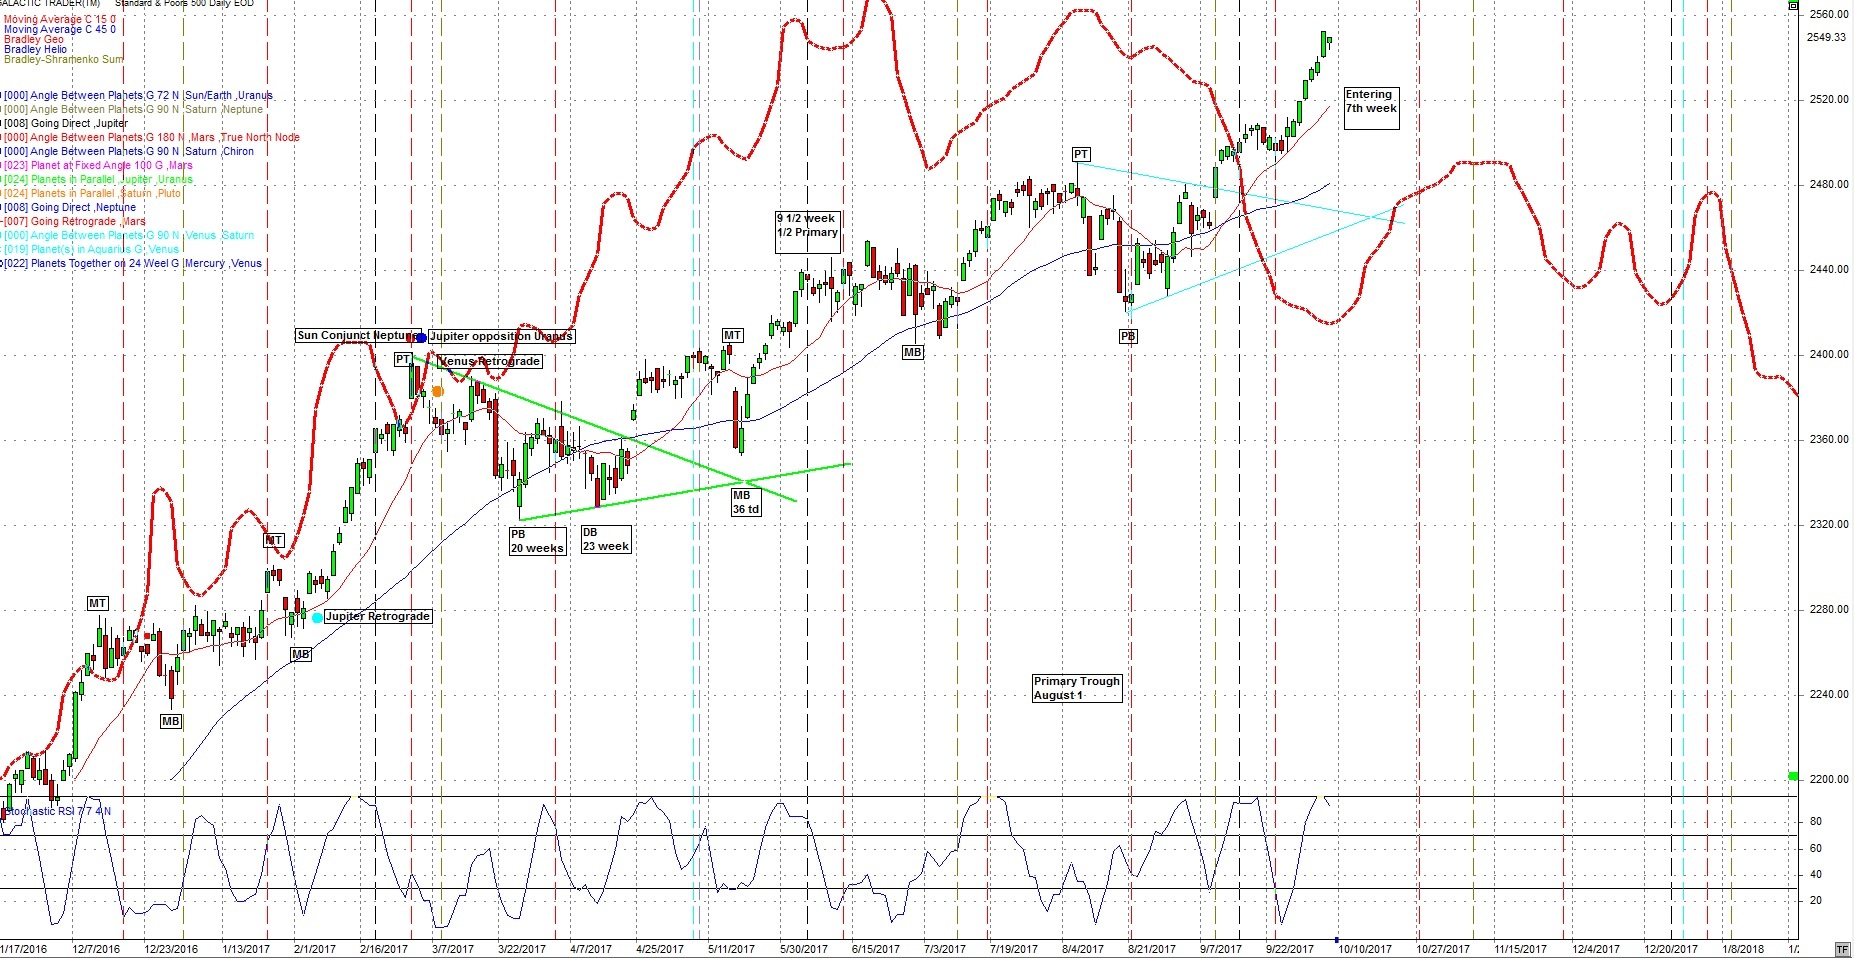
On Monday, October 9th there is a Sun square Pluto aspect. The indices often go down after this aspect. October 9 is also 34 tds (trading days and a Fibonacci number.) from the August 21 Primary trough.
There are a number of different types of Astrology. The two main types are Vedic and Western Astrology. We mainly use Western / Mundane Astrology on this blog but occasionally will use Vedic Astrology. In Vedic Astrology, the financial markets often go down when Venus moves through Vedic Virgo. That starts Monday, October 9th as well.
Jupiter will be entering Scorpio this week, a fixed water sign. Jupiter, known as the grand benefit can also indicate that which is overdone, particularly in the intense sign of Scorpio. In mundane astrology, Scorpio relates to financial relations with foreign countries, crime, and public safety. This may manifest in the religious or judicial world. The national or state religion and priests. The justice system, prominent judges, barristers and national inquiries. Jupiter in Scorpio would also refer to a nation’s wealth, banks and bankers. Watch for these in the coming weeks. Jupiter spends approx. 1 year in a sign.
The longer-term aspects we have been mentioning are still in orb.
Jupiter in opposition to Uranus on September 28.
Mars in opposition to Neptune on September 24.
There is also a third aspect on October 7th, Uranus semi-square Neptune. This is the 172-year cycle. I don’t usually cover semi-squares but this aspect is between two long orbit planets. These two planets have been close to a semi-square for a number of months.
I had also mentioned that this timeframe may affect Israel and possibly other countries. North Korea is still active and may be for some time. Watch October 7 - 11 for actions that may have longer-term consequences.
From “The Book of Rules” aka “Rule for Planetary-Picture’s.
Uranus/Neptune
Suddenly incapacitated, unconsciousness, Checkmated, Crisis, Revolution, Dead Persons.
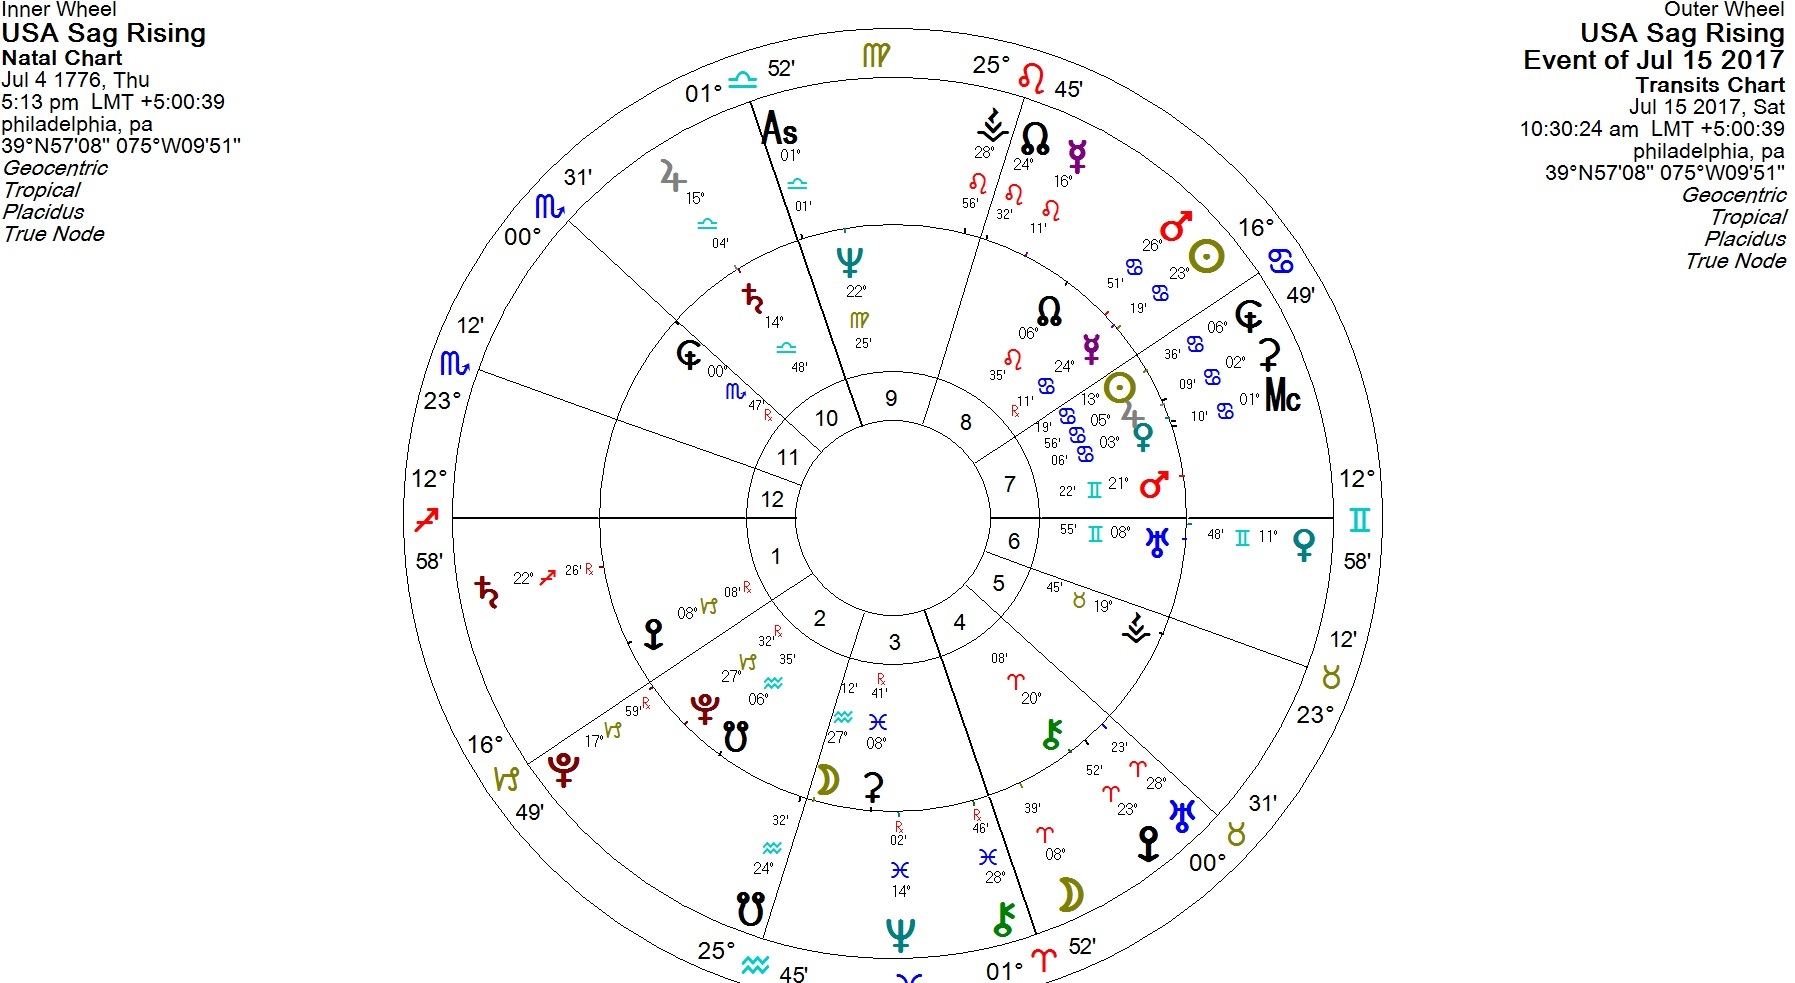
In addition to the above, there is a potent transit between transiting Saturn square the USA natal Neptune. Hard aspects to the USA's Neptune and Mars often coincide with financial disruption. Saturn will square the USA Neptune and oppose it's natal Mars 3 times in 2017. January, July, and October.
The effect of Saturn square Neptune can be deflationary. With the buildup of credit in the economic aspects could bring on defaults, cash shortages putting stress on the credit markets. Saturn/Uranus is coming up in November.
From a Mundane Astrology perspective, it covers socialism and left-wing political ideas. It is associated with mobs, secret plots, fraud, swindling, bogus companies, loss, and liquidation. This same aspect was near exact during the election period
From “The Book of Rules” aka “Rule for Planetary-Picture’s.
Saturn/Neptune
Habit, things of long duration, sickness, chronic conditions.
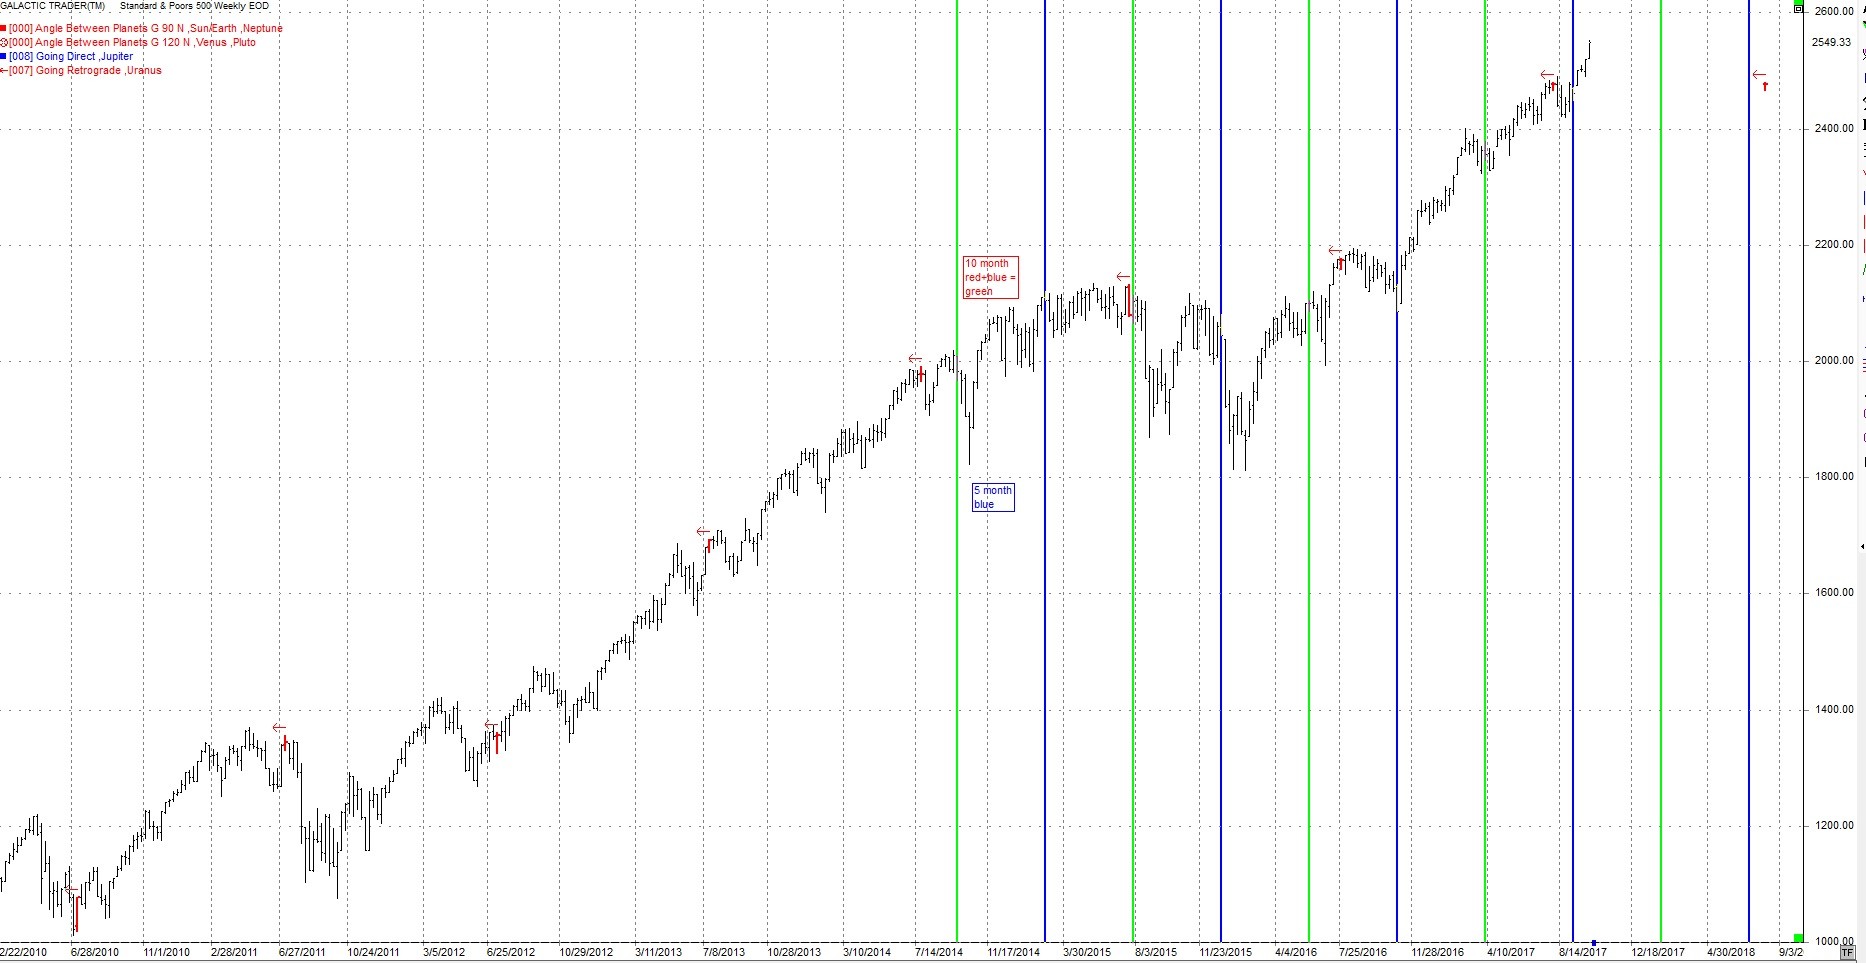
The following weekly chart of the SP500 shows the 5-month (blue) and 10-month (red). The 5-month cycle was September 4. The 5-month cycle often is at the start of a slide down but not sliding yet. This looks to be inverted.
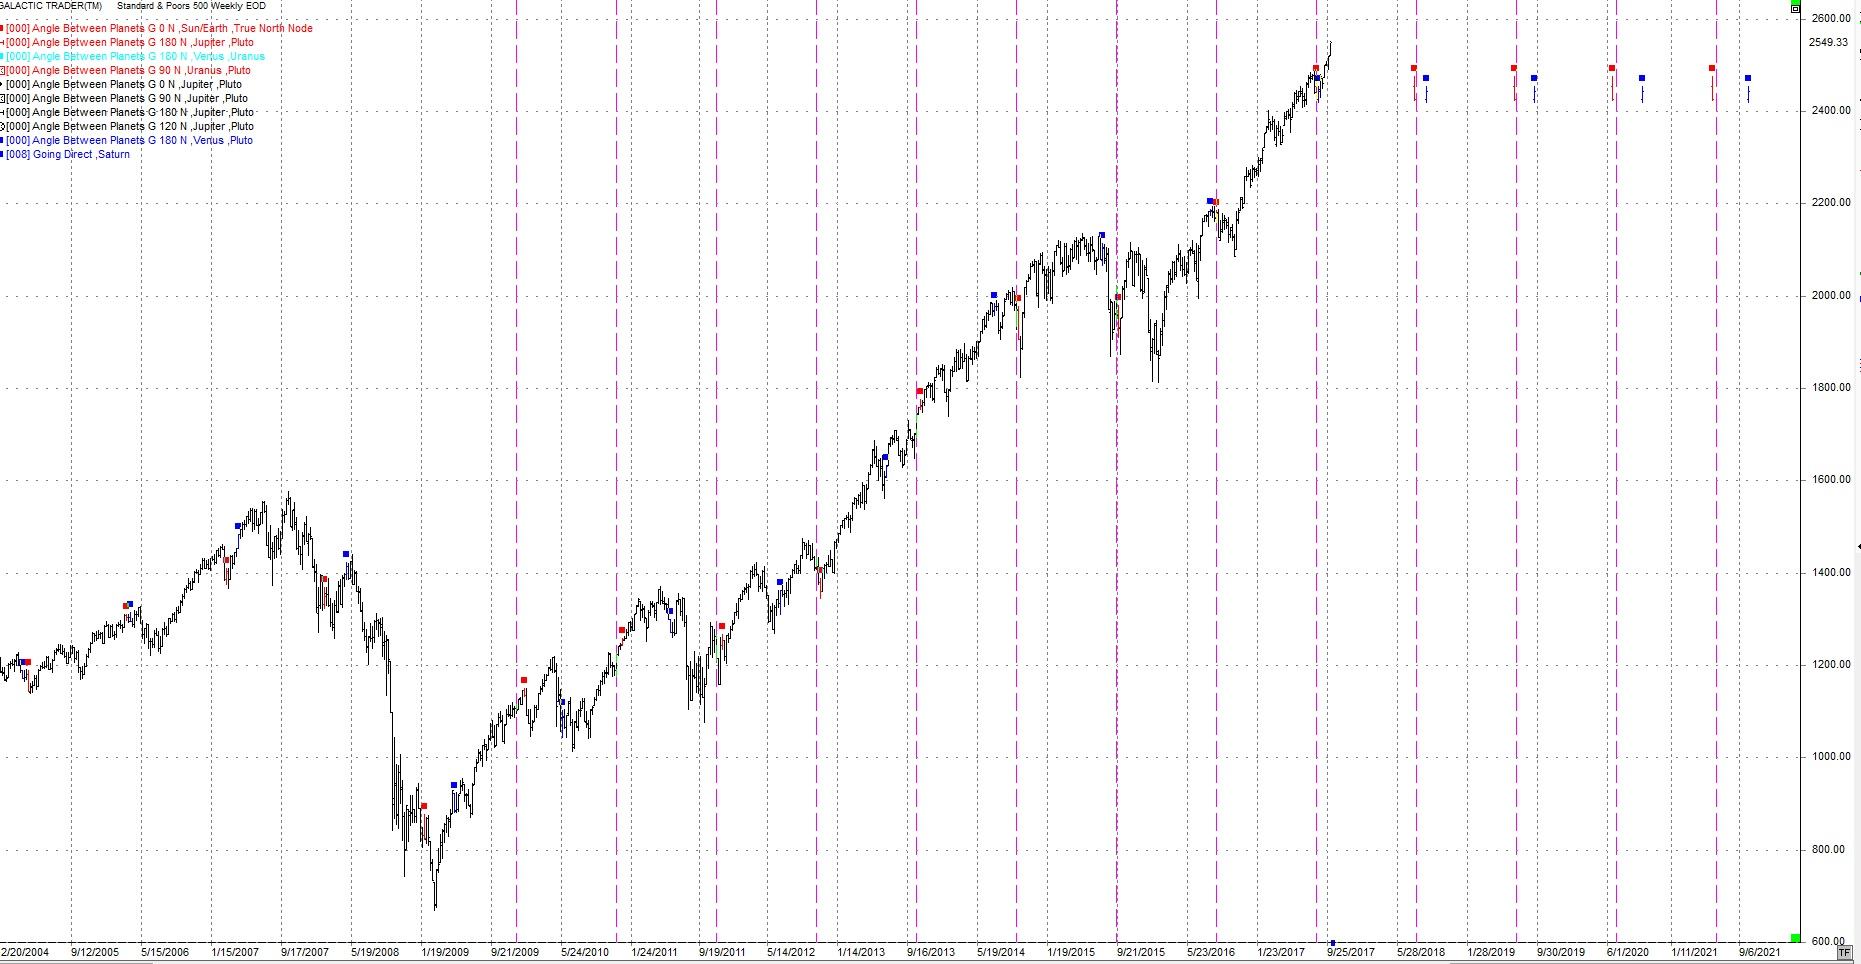
The Pluto Direct signature on Sept 28 has a history of occurring close to 50-week cycles.
The following chart is the 50-week cycle. The pink vertical lines are the 50-week cycle. The red squares show the Sun conjunct the North Node. The blue squares are Saturn turning direct. Both signatures have a history with the 50-week cycle.
I had mentioned a math-based approach on the Gold section in last weeks blog. It had forecast a low on September 26 +- 1 td (trading days).
I’ve tried one more and it is forecasting a change in trend for the SP500. The date is October 9 again +- 1 td.
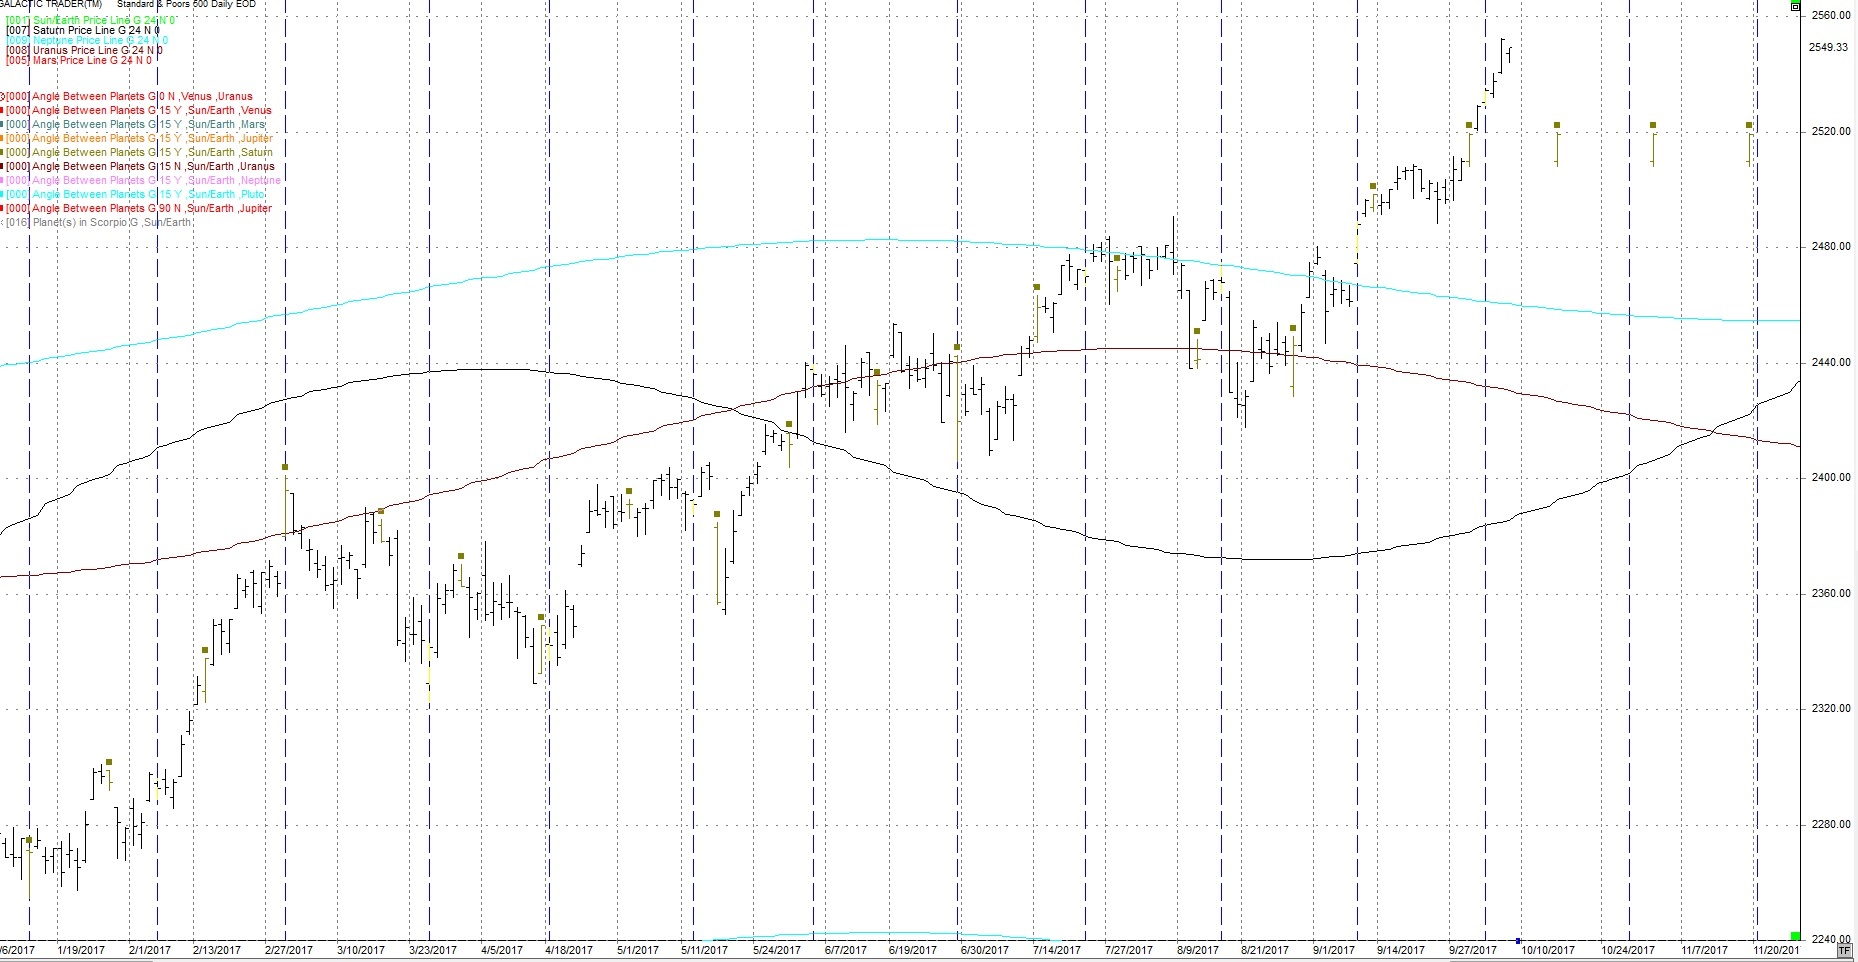
I continue to watch the 24th harmonic cycle (360/24) cycles for short-term turns. The brown squares are Sun/Saturn 24 degrees on the following daily chart. The blue vertical lines are 24 cd’s (calendar days).
The next hits are Oct 16 then Nov 1st.
I have added 3 price lines to this chart.
Saturn - black
Uranus - purple
Neptune - light blue
These price lines can act as support/resistance. It has been at highs and lows. Note also when they cross often gets a reaction in price on a short-term basis. Also note, near the top of the chart is a light blue line. This is the Neptune PriceLine. Note how it has been strong resistance to price but has broken through.
In summary with the aspects in front of us, I’m looking for a surprise event to turn the markets within the next two weeks. No matter what the foretasted price movement is, the reality is the major US indices are in weekly uptrends. The indices have to start moving down. For example the SP500 below 2485.
Author

TradingDaze
Aisys Technologies Inc.
Gordon Lawson, aka TradingDaze, is a Canadian CPA, certified computer programmer and Astrologer. My traditional career spanned 25 years as a Financial Analyst at Suncor and Manager of Information Systems at BP Resources Canada. After this time Mr.


