S&P 500 Update: 6100-6200 is next.

While most were bearish in early April—and many still are—we have provided bullish updates for the SP500 (SPX), even though the Elliott Wave roadmap has slightly shifted. This is because we have yet to see five larger waves rise from that March 2020 low. Additionally, we presented a multitude of bullish signals, including the recent Zweig Breadth Thrust, which supported our optimistic stance.
Fast forward, and the SPX has gained another 7.6% since our last update. And we believe there’s more gas left in the tank. See Figure 1 below.
Figure 1. Our preferred short-term Elliott Wave count for the S&P 500.
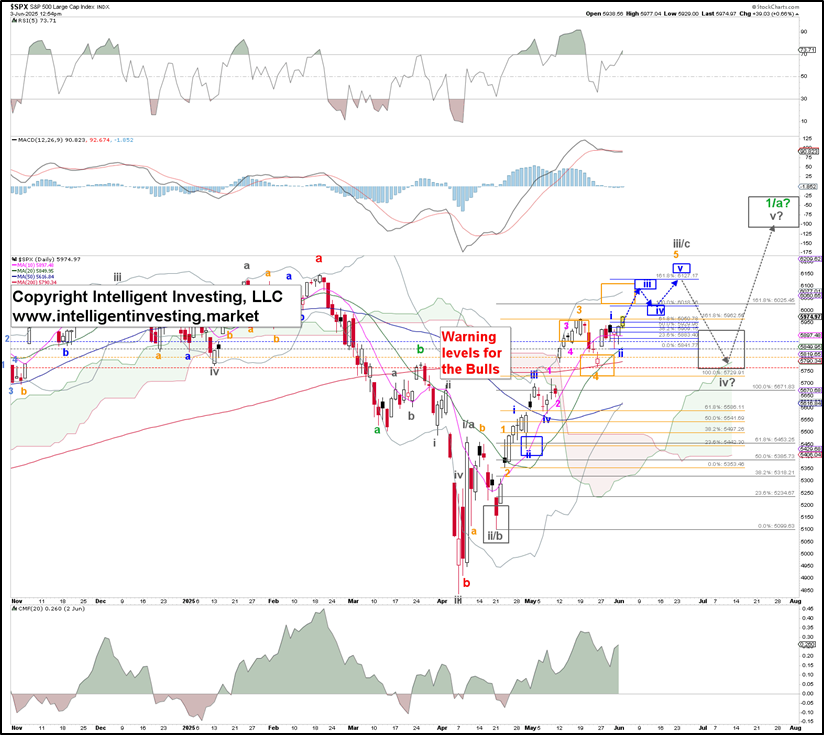
The price action from the May 23 low supports a (blue) W-i, ii setup, provided it remains above the warning levels: blue (1st warning level for the bulls) at $5870, grey (2nd warning level) at $5841, orange (3rd warning level) at $5805, and red (final warning level) at $5762. Blue W-iii can target $6,125+/25, Blue W-iv $6,000+/-25, and W-v of the then-extended orange W-5 can ideally reach $6,150-6,200. From there, the market can decide whether to add the grey W-iv, v (preferred) or not. For now, we aim to ideally complete the grey W-iii/c, with a subdividing orange W-5 underway.
Returning to the shifted EW-based roadmap, and considering that there are still no five larger waves from the March 2020 COVID-19 low (see Figure 2 below), we observe the index at the starting gates of the red W-c of the black W-3: green W-1/a.
Figure 2. The SPX weekly chart has our preferred EW count.
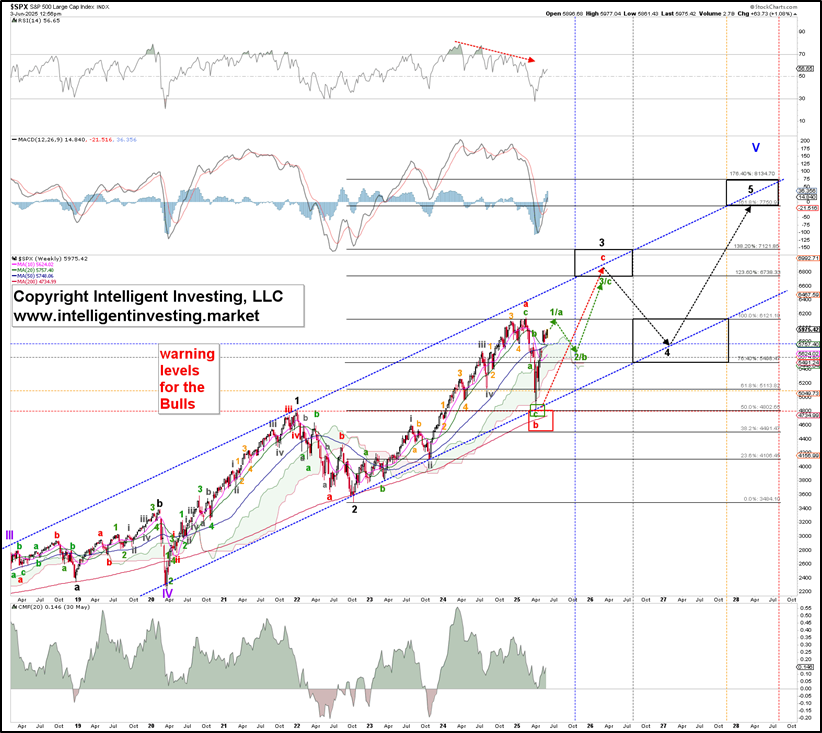
Why label the current rally as (green) W-1/a? Because the ongoing bull market from the 2020 low can morph into an ending diagonal (ED). In that case, the (black) 3rd wave comprises three waves: red W-a, -b, and -c. And although C-waves often comprise five waves, due to the overarching ED structure we may only get three waves.
Namely, the April low was almost a 50% retracement of the October 2022 low to the February 2025 ATH rally. That is more typical B-wave behavior as 4th waves tend to retrace ~38.2%, which is why we were initially looking for the SPX to bottom around the $5,116 level. Moreover, the recent 2+ year rally can be counted as three (green) waves: red W-a.
Our ongoing objective analysis of the stock market’s price charts and related indicators has enabled us to clarify their status during these volatile weeks, avoiding bias and subjectivity. This approach has kept our premium Newsletter members consistently on the right side of the trade: long. Consequently, we continue to sound the bullish horn during these uncertain times for as long as the index stays above its critical levels.
Author

Dr. Arnout Ter Schure
Intelligent Investing, LLC
After having worked for over ten years within the field of energy and the environment, Dr.


