S&P 500 Likely To Morph Into A Bear Market

The all-time highs of the past few trading days probably kicked off a larger cyclical correction in US equity indices. This conclusion is based on statistical evidence and technical analysis. Descriptive statistics show that the current cycle is at the very long end in comparison to what the US economy witnessed during the past 150 years. Moreover, a longer-term technical analysis perspective suggests that the stage is set for a cyclical correction. The same analysis concluded that the only missing link is a termination of the short-term trend since 2016. This is most likely no longer the case as of last week.
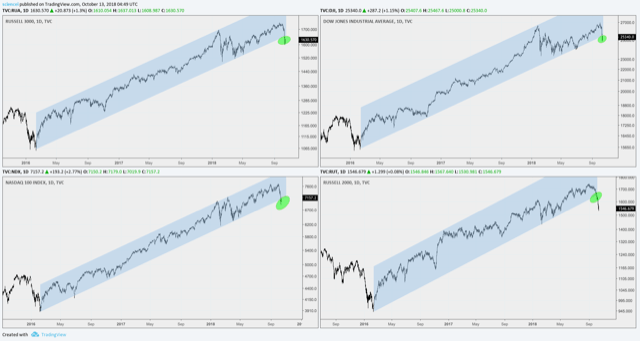
Broad-based weakness across worldwide equities carried the S&P 500 index outside of the trend that unfolded since 2016. All major US indices jointly broke their respective mid-term trend support. The very first chart shows a few examples of the damage created by last week’s price action within a bigger picture. A green ellipse highlights the trend break of the Russell 3000, Russell 2000, Nasdaq 100, and DJIA indices.
Technical analysts refer to this as cross-market confirmation. The next rebound will either confirm the signal or invalidate the trend break. Our base case is that it will be a counter-trend bounce on the majority of US indices if not all of them.
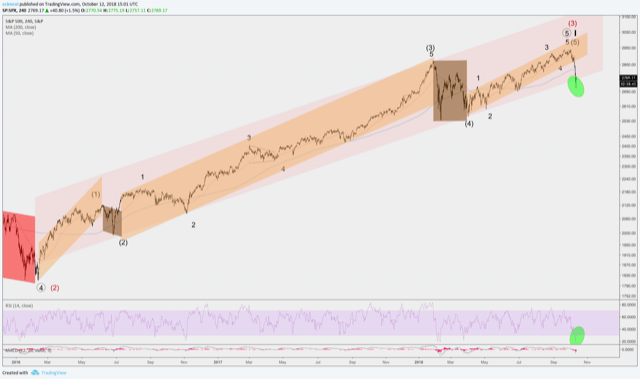
This conclusion is based on the Elliott wave framework. It states that trends unfold within five wave fractals to an impulse. An impulse is simply the dominant trend. Our Elliott wave analysis for the S&P 500’s trend since 2016 is depicted in the second chart. It highlights five distinctive trends, which Elliott wave analysts call waves, that unfolded within the pale red paramount trend. Three of these trends unfold to the upside whereas two trends are corrective. The former are highlighted in orange whereas the latter are highlighted in brown.
The weakness of the past few trading days was broad-based across all major equity indices worldwide. Moreover, most of the major indices showed maximum strength during this week’s selloff. Classical technical analysis suggests that continuation persists until the trend “fades” on decreasing strength. Hence, momentum indicators signal that the S&P 500 is likely to continue the recent correction. This, in turn, results into an even clearer break of the trend since 2016.
Last but not least, equity indices worldwide diverged to each other during the past few months. Their all-time high or recovery high occurred months apart from other major indices. That’s a typical phenomenon around cyclical tops and bottoms. The months before the crises of 2000 and 2007 are good examples. Both periods recorded tops, which were months apart for the major equity indices worldwide. Hence, we are faced with a different setup today than we witnessed back in February of this year. Major indices confirmed the top altogether back then. That’s no longer the case today. It appears much riskier to “catch the falling knife.”
All in all, the bigger picture suggests that investors should be more concerned about a cyclical turn than about the right entry point to buy-this-dip at this stage. The highs of the past few trading days could be of at least an intermediate degree. This implies a cyclical correction and a bearish trend for the months ahead.
The information content of the analysis above has distributed to our subscribers last week. This week’s update discusses specific targets as well as exact paths that we expect the market to unfold.
Interested in more of our ideas? Check out Scienceinvesting for more details!
Interested in more of our ideas? Check out Scienceinvesting for more details!
Author

Science Investing Team
Science Investing


