Recap 8/15 - The S&P opened with an 11 handle gap down and then declined another 12 handles for a first minute low of the day. From that low, the S&P rallied 24 handles into a 9:59 AM high. From that high, the S&P declined 17 handles into an 11:13 AM low. From that low, the S&P rallied 38 handles into a 3:50 PM high of the day. From that high, the S&P pulled back 6 handles into the close.

Chart

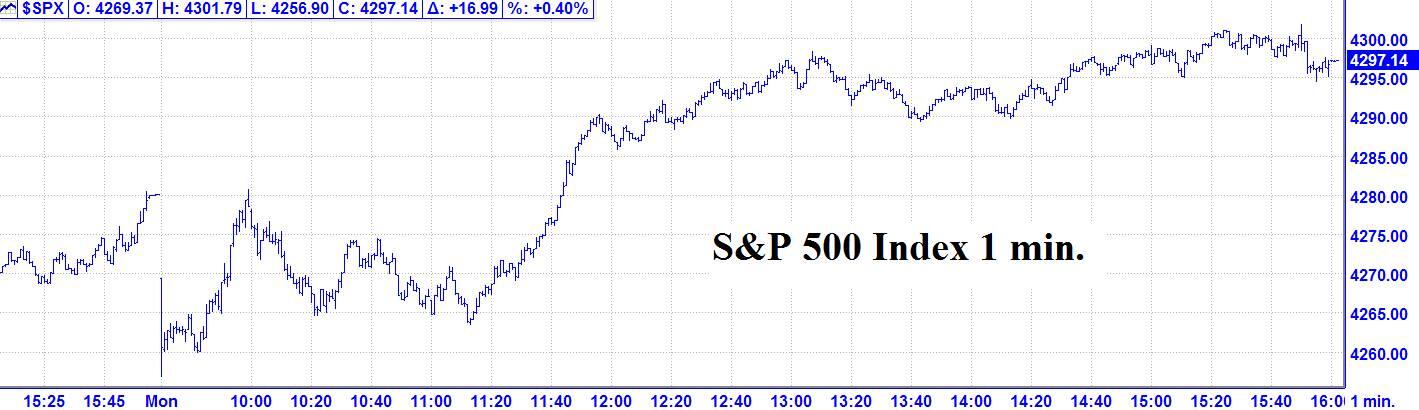
8/15 – The major indices had a small to moderate up day to finish with the following closes: DJIA + 151.31; S&P 500 + 16.99; and the Nasdaq Comp. + 80.87. 8/15 Review – We were looking for a possible first hour high and instead got a first hour low. There is a slim chance this could still work if the market immediately turns down during Tuesday’s first hour. Otherwise, we’ll have to chalk up the 8/12 AC change in trend as a miss.

Looking Ahead – We have three points indicating a turn for 8/17. Please see details below.

The Now Index is in the NEUTRAL ZONE.

Coming events

(Stocks potentially respond to all events).

2. D. 8/12 AC – Moon’s North Node Parallel Uranus. Major change in trend CATTLE, COTTON, Copper, Silver.

E. 8/16 AC – Helio Jupiter enters Aries. Major change in trend Coffee, Corn, Gold, Oats, OJ, Silver, Sugar, Wheat.

F. 8/18 AC – Moon’s North Node 45 US Venus. Moderate change in trend US Stocks, T-Bonds, US Dollar.

G. 8/19 AC – Geo Mars enters Gemini. Important change in trend Stocks.

Stock market key dates

Market math

8/17 = 20,643 music days > 2/09/1966 MAJOR HIGH.

8/23 = 17,424 (132^2) days > 12/09/1974 MAJOR LOW.

8/28 = 8,192 music days > 3/24/2000 MAJOR HIGH.

Fibonacci – 8/17, 8/22,

Astro – 8/12, 8/15, 8/19, 8/24, 8/26 AC.

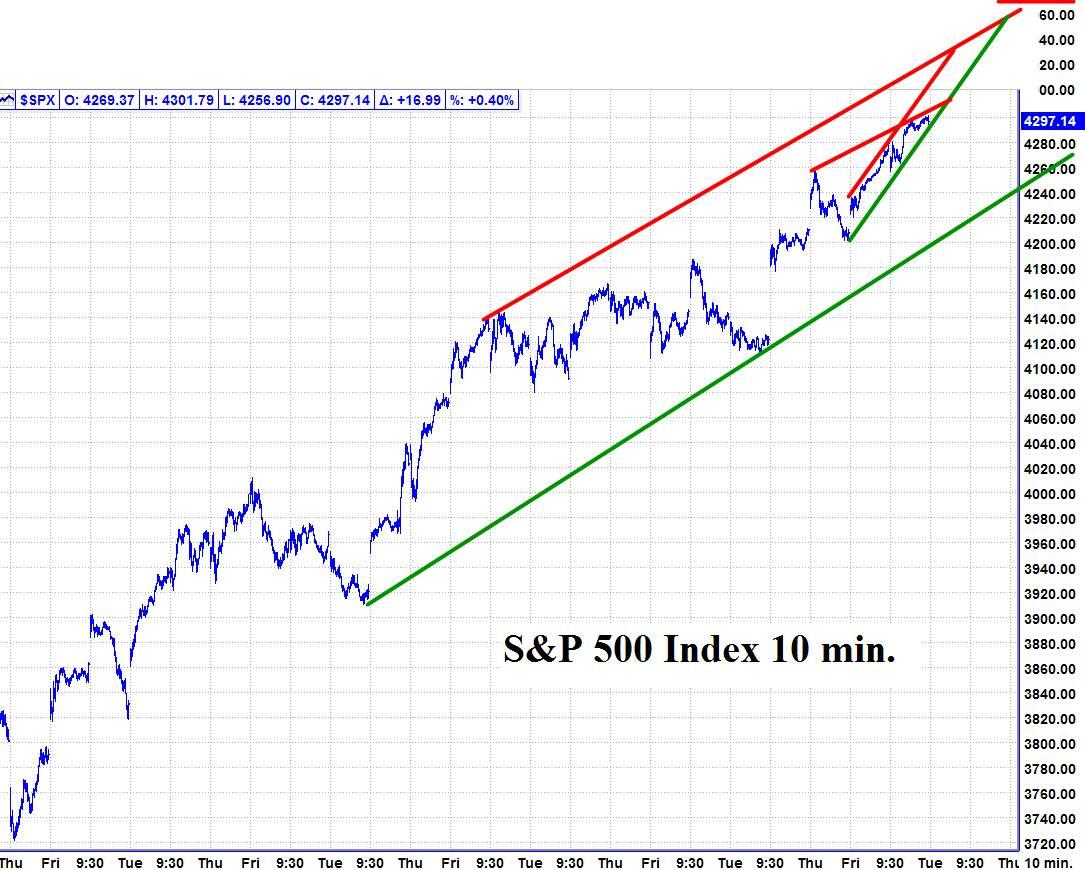
Please see below the S&P 500 10 minute chart.

Support - 4285, 4228 Resistance – 4310, 4367.

Chart

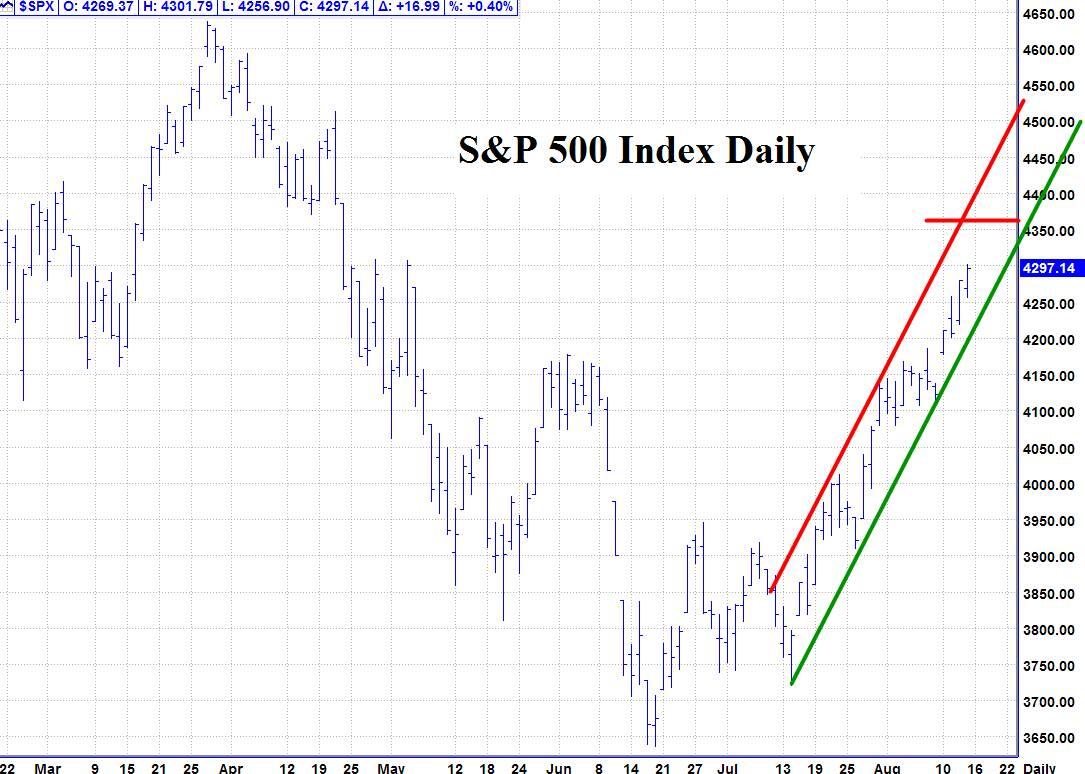
Please see below the S&P 500 Daily chart.

Support - 4285, 4228 Resistance – 4310, 4367.

Chart

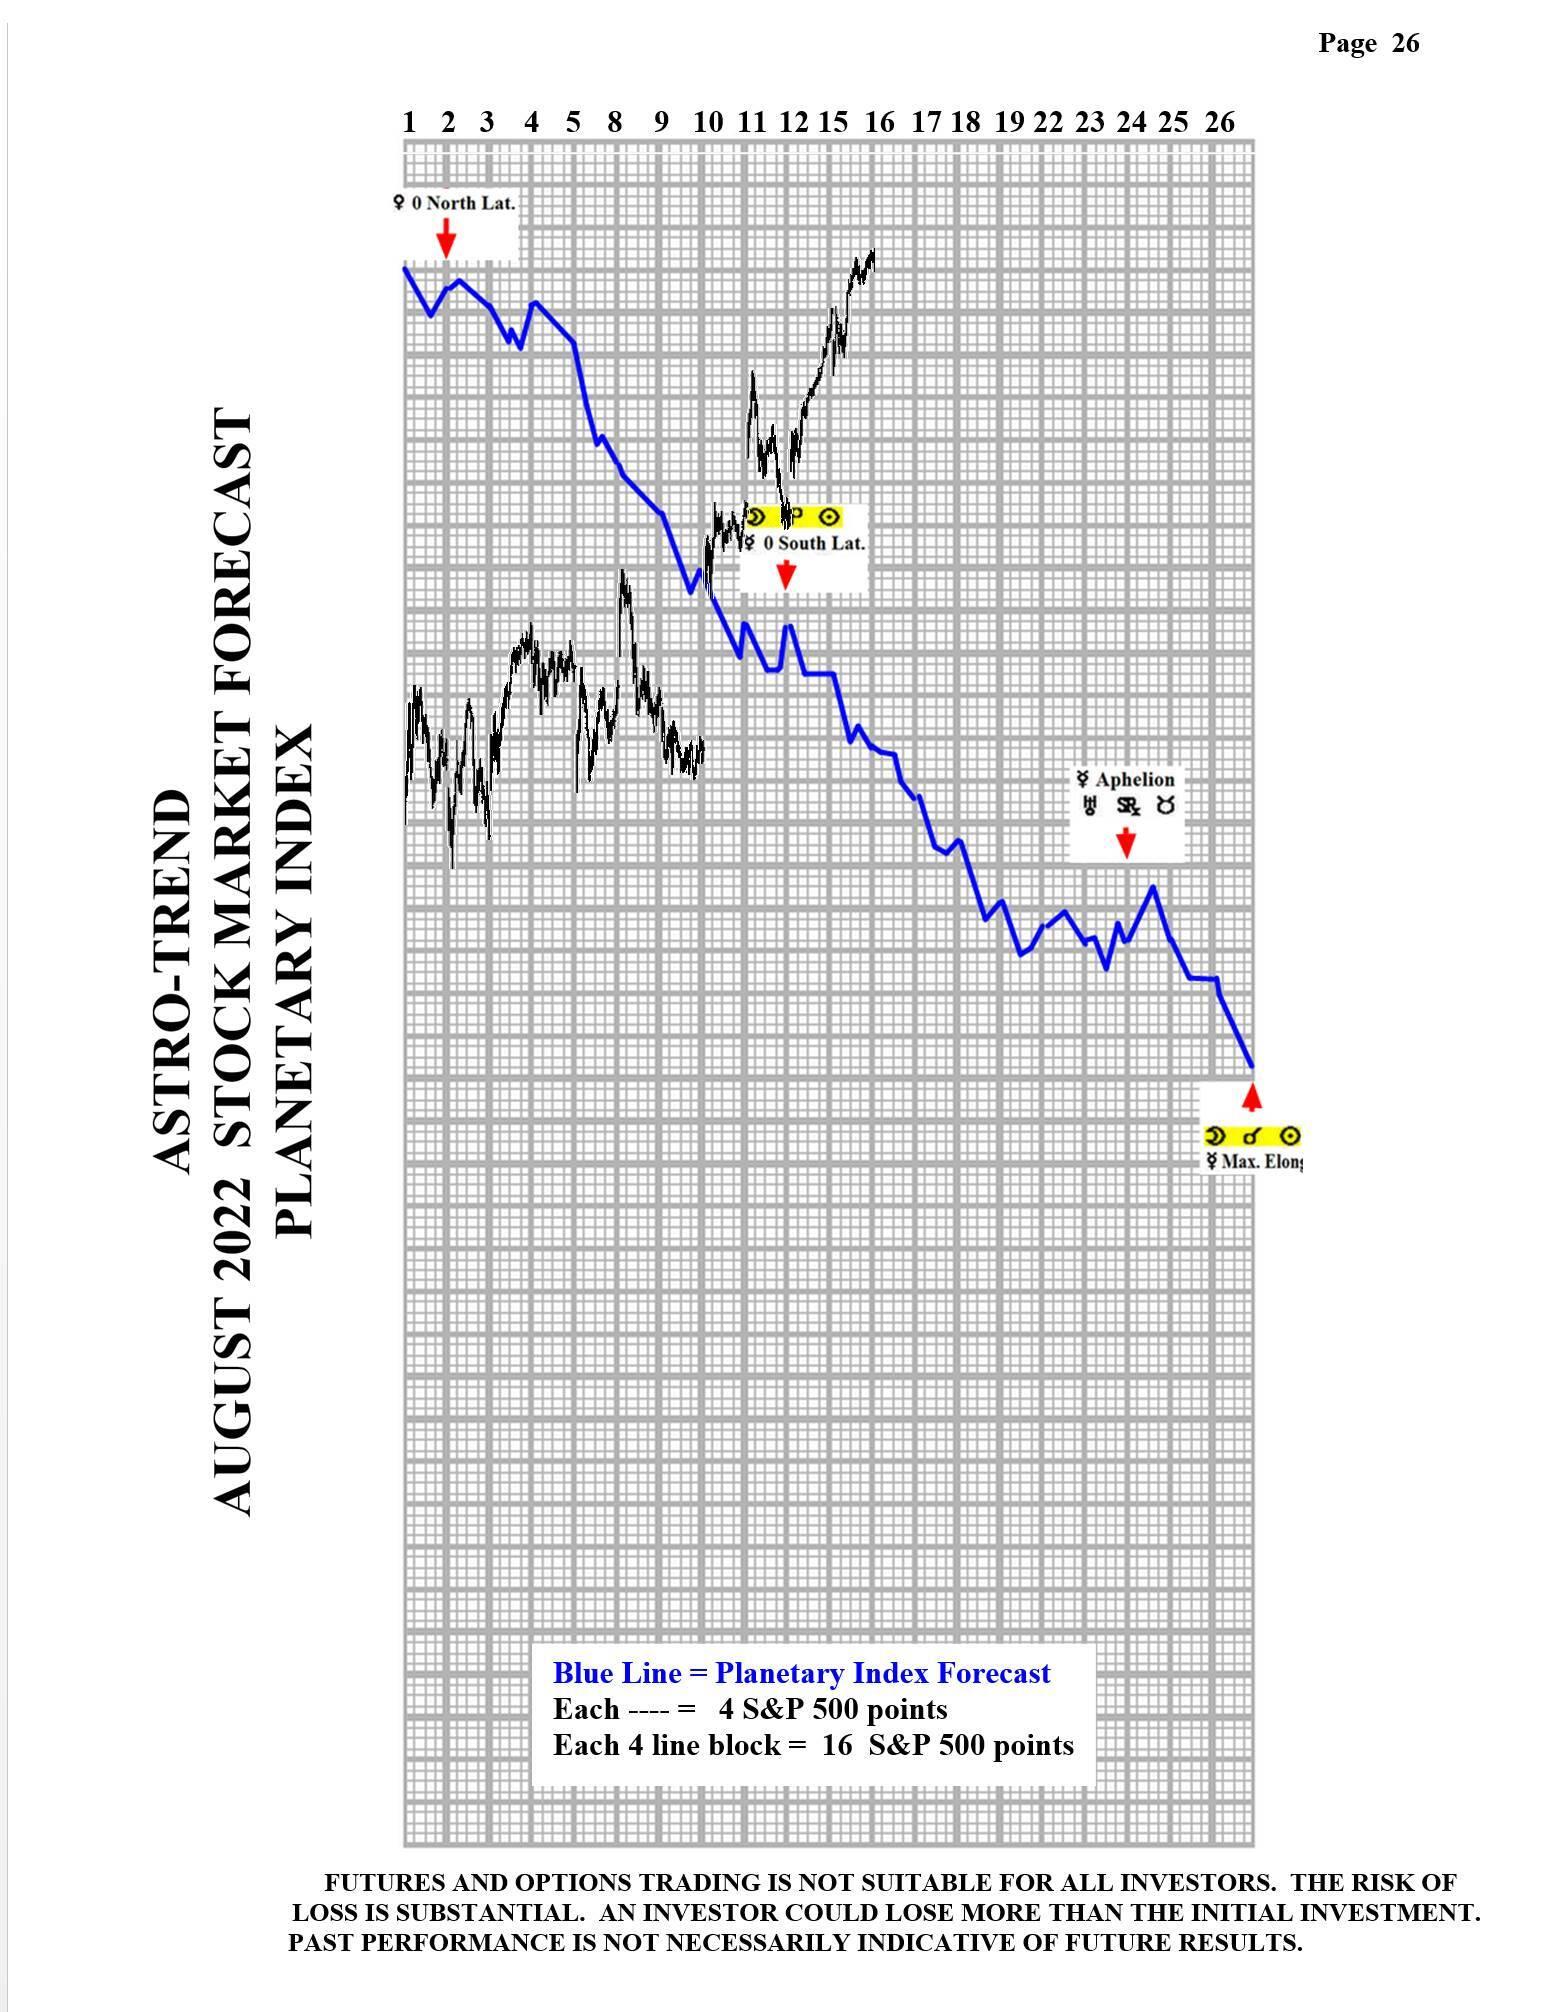
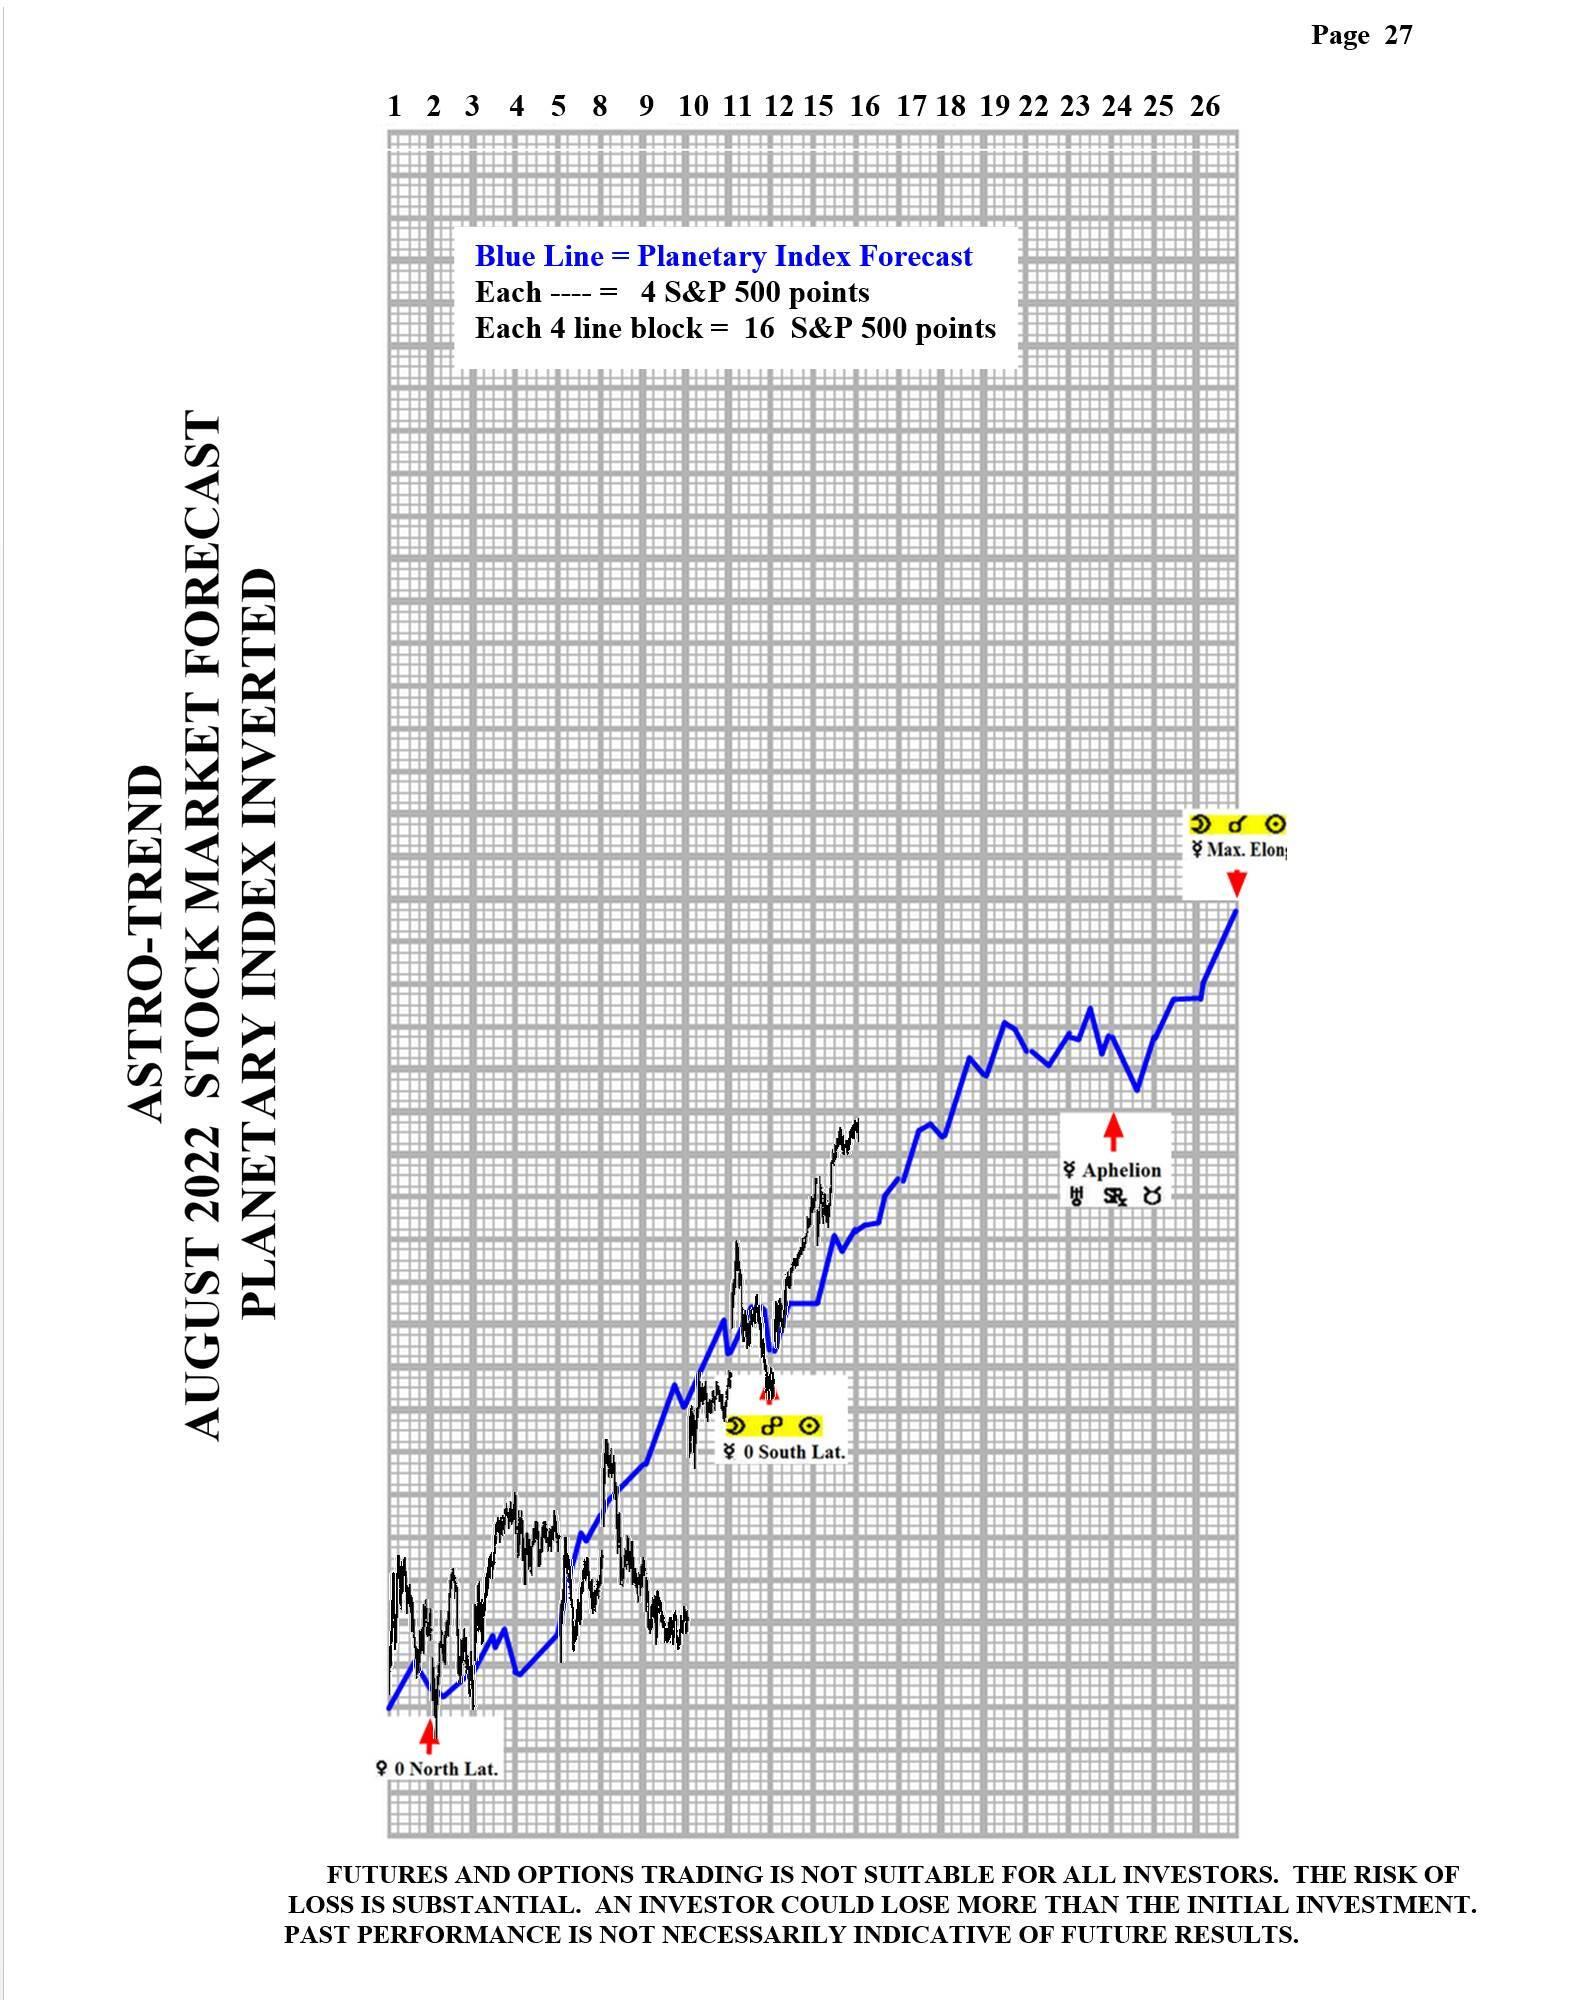
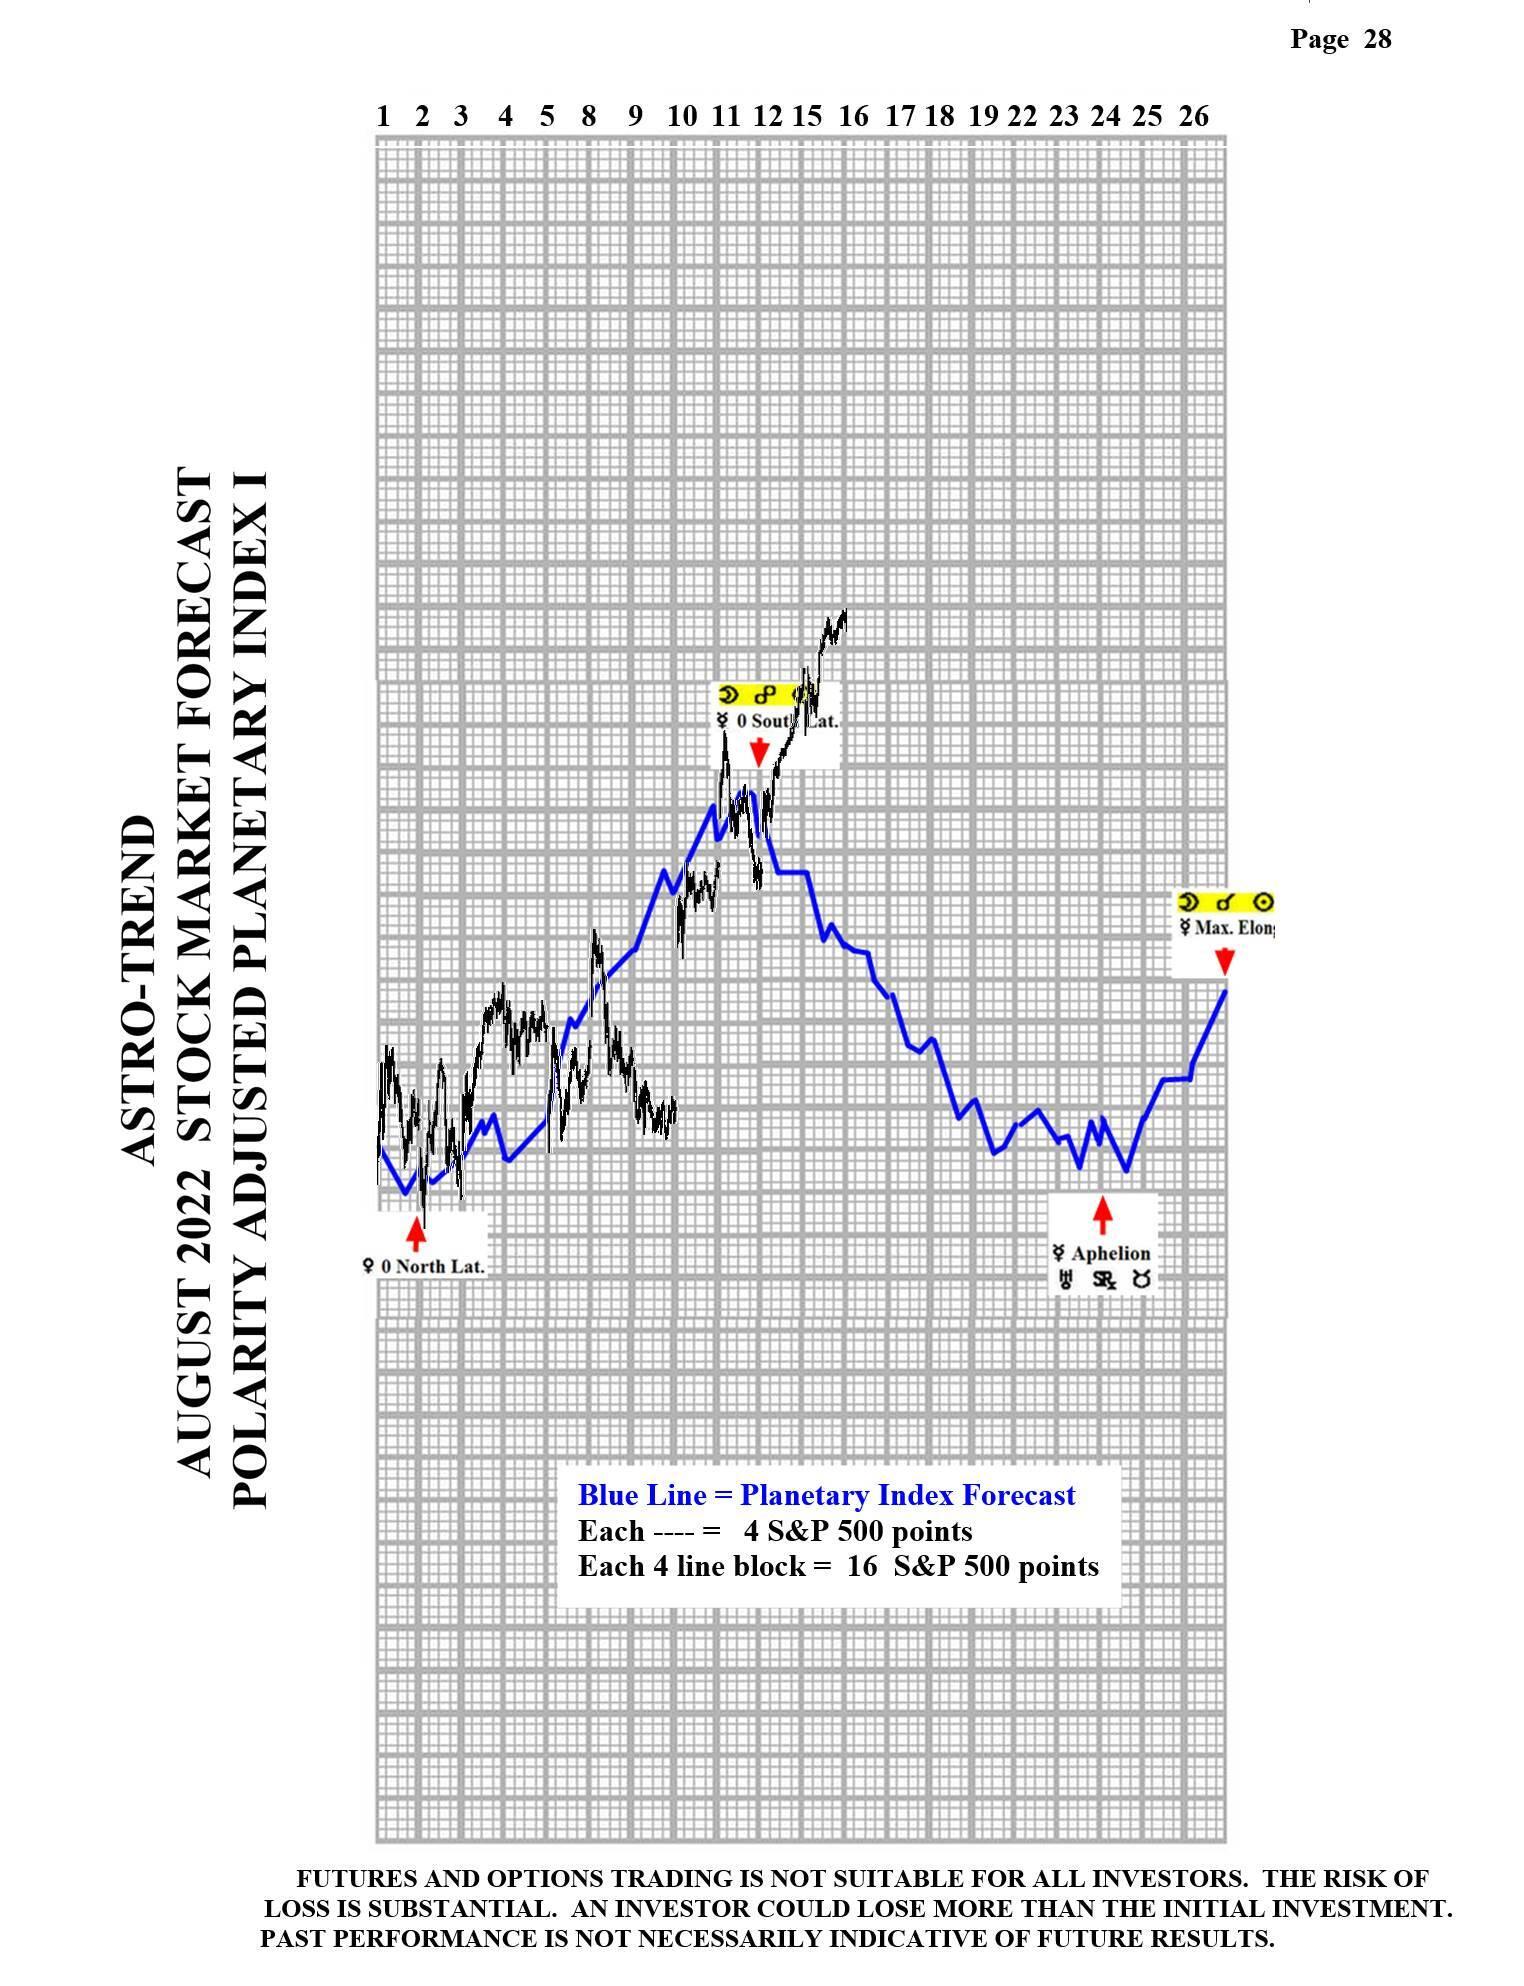
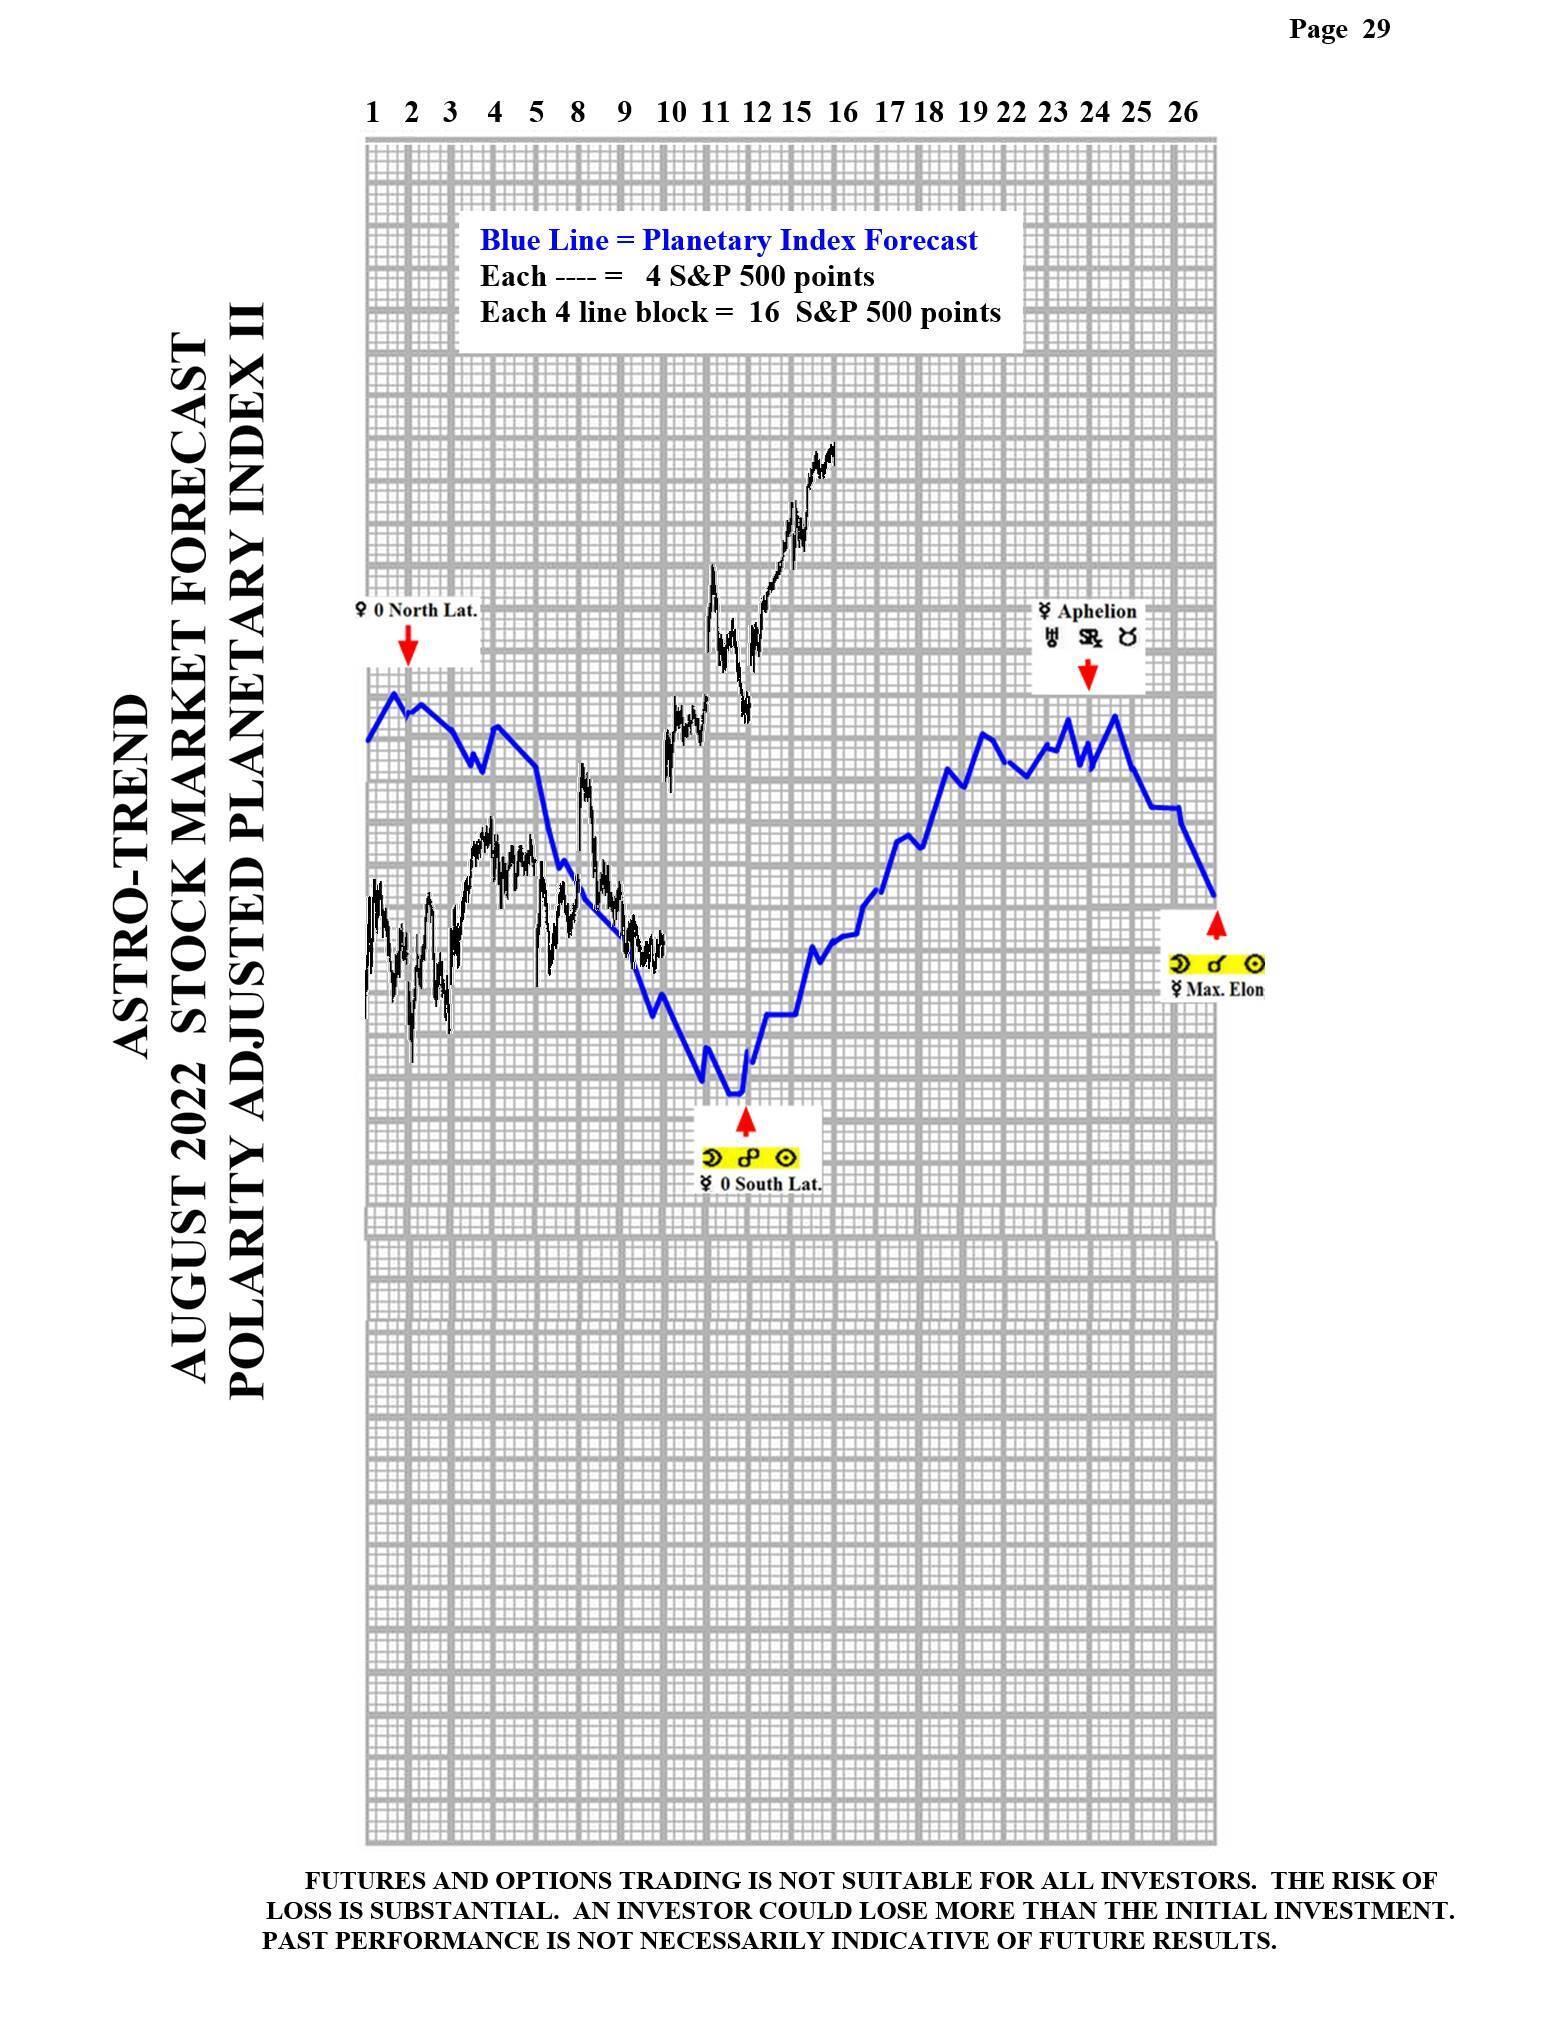
Please see below the August Planetary Index chart with S&P 500 10 minute bars for results.

ChartChartChartChart

Note: All information on this page is subject to change. The use of this website constitutes acceptance of our user agreement. Please read our privacy policy and legal disclaimer. Opinions expressed at FXstreet.com are those of the individual authors and do not necessarily represent the opinion of FXstreet.com or its management. Risk Disclosure: Trading foreign exchange on margin carries a high level of risk, and may not be suitable for all investors. The high degree of leverage can work against you as well as for you. Before deciding to invest in foreign exchange you should carefully consider your investment objectives, level of experience, and risk appetite. The possibility exists that you could sustain a loss of some or all of your initial investment and therefore you should not invest money that you cannot afford to lose. You should be aware of all the risks associated with foreign exchange trading, and seek advice from an independent financial advisor if you have any doubts.

Recommended Content


Recommended Content

Editors’ Picks

AUD/USD remained bid above 0.6500

AUD/USD remained bid above 0.6500

AUD/USD extended further its bullish performance, advancing for the fourth session in a row on Thursday, although a sustainable breakout of the key 200-day SMA at 0.6526 still remain elusive.

AUD/USD News

EUR/USD faces a minor resistance near at 1.0750

EUR/USD faces a minor resistance near at 1.0750

EUR/USD quickly left behind Wednesday’s small downtick and resumed its uptrend north of 1.0700 the figure, always on the back of the persistent sell-off in the US Dollar ahead of key PCE data on Friday.

EUR/USD News

Gold holds around $2,330 after dismal US data

Gold holds around $2,330 after dismal US data

Gold fell below $2,320 in the early American session as US yields shot higher after the data showed a significant increase in the US GDP price deflator in Q1. With safe-haven flows dominating the markets, however, XAU/USD reversed its direction and rose above $2,340.

Gold News

Bitcoin price continues to get rejected from $65K resistance as SEC delays decision on spot BTC ETF options

Bitcoin price continues to get rejected from $65K resistance as SEC delays decision on spot BTC ETF options

Bitcoin (BTC) price has markets in disarray, provoking a broader market crash as it slumped to the $62,000 range on Thursday. Meanwhile, reverberations from spot BTC exchange-traded funds (ETFs) continue to influence the market.

Read more

US economy: slower growth with stronger inflation

US economy: slower growth with stronger inflation

The dollar strengthened, and stocks fell after statistical data from the US. The focus was on the preliminary estimate of GDP for the first quarter. Annualised quarterly growth came in at just 1.6%, down from the 2.5% and 3.4% previously forecast.

Read more

Majors

Cryptocurrencies

Signatures