S&P 500 bounces from 50-Day SMA: What is different?

The repeating technical pattern in the large-cap index has repeated itself once again. How long can this phenomenon last, and what is different in the underlying market this time?
Greetings. I hope this article finds you well and that you are using the strength in the equity markets today and yesterday to shore up your overall long exposure and getting some dry powder available.
Usually, I would be feeling like this is the easy part of the $SPX bounce; a quick move lower to the 50-day SMA, then the second up day where it just creeps higher on low volatility. That has been the pattern since the pandemic lows in March 2020.
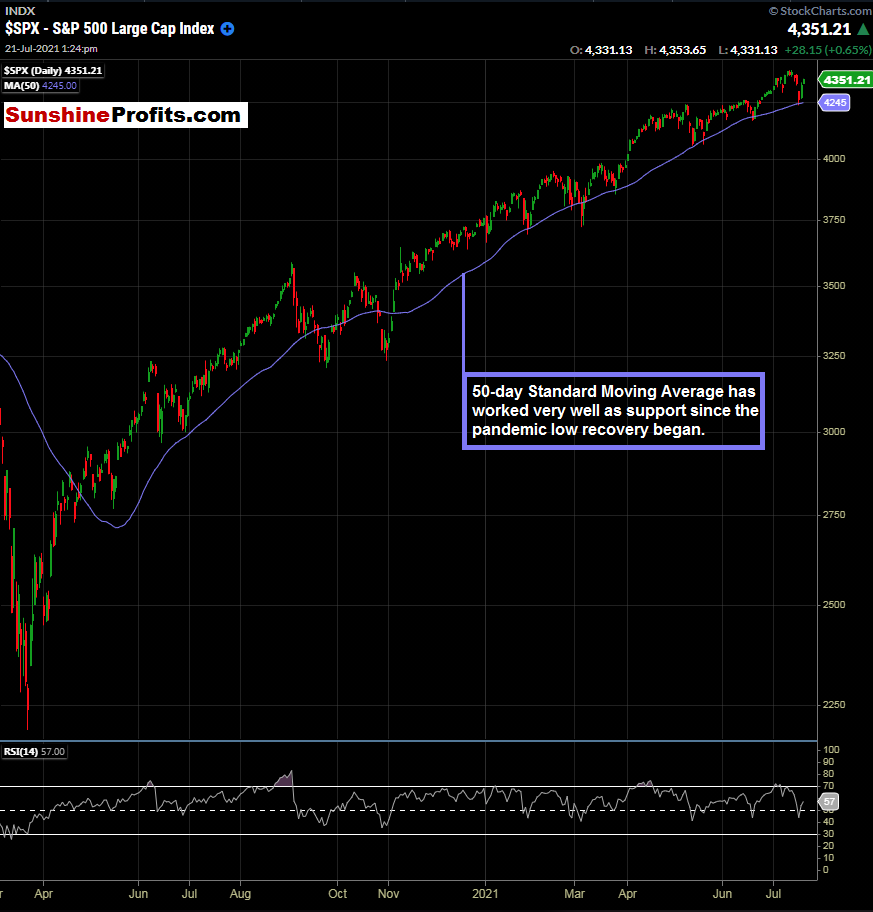
Figure 1 - S&P 500 Index March 5, 2020 - July 21, 2021, Daily Candles Source stockcharts.com
We have discussed the 50-day SMA phenomenon at length in previous articles and used them as a basis for entries, so please feel free to peruse them for additional detail.
However, this time, I just couldn’t get as enthusiastic about it.
Yesterday, in an article for Premium Subscribers, we mentioned the percentage of stocks that are currently trading below their 200-day standard moving averages.
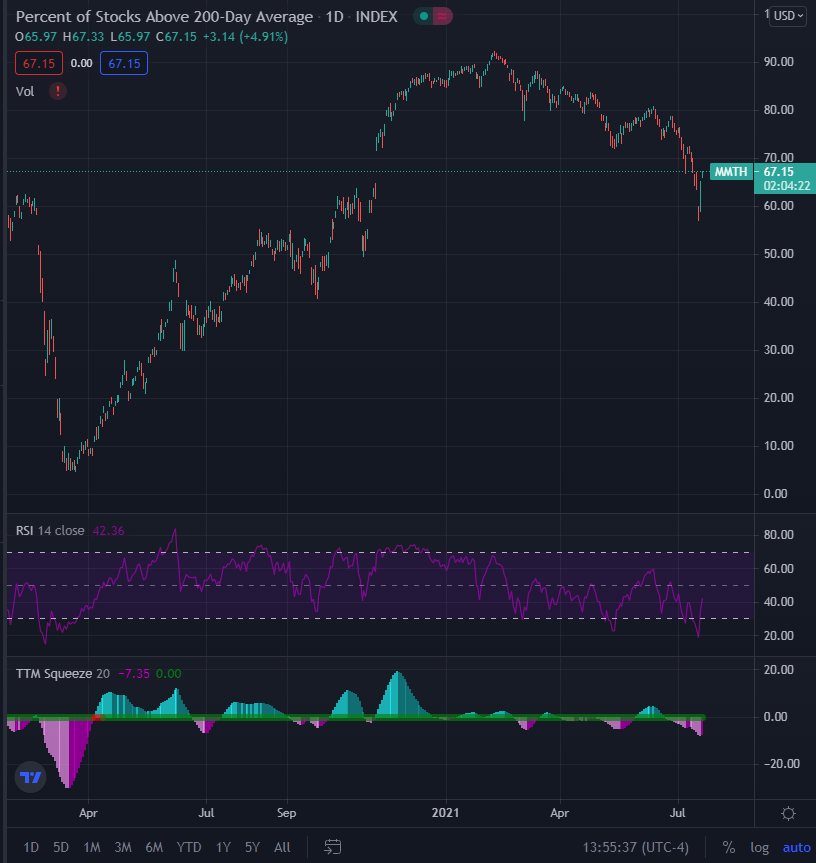
Figure 2 - MMTH Index Percentage of Stocks Trading Above 200-Day Moving Average July 3, 2018 - July 21, 2021, Daily Candles Source tradingview.com
We can see above that the percentage of stocks trading above their key 200-day standard moving average peaked back in February. Many stocks dipped below their key 200-day moving average during the selloff earlier on Friday and Monday. However, we do still have this internal market indicator showing weakness.
We also have the interest rate conundrum that is currently facing the markets. Please see the July 15th publication for additional color in this area.
CPI Data & Interest Rates
We have higher prices across the board for many goods and services. What continues to fuel the demand at higher prices? Direct stimulus and artificially low interest rates are partially to blame for this. When you logically think about this, what will happen when interest rates rise? Will they rise? What about if the Fed begins to taper bond purchases and the market throws a “taper tantrum”?
Delta Variant & Olympics
As the delta variant has been making its way around the newswires for several weeks, markets finally began to take notice last Friday. As the start of the Olympic Games is slated for July 23, 2021 (just 2 days away), there has been some chatter about the Olympic Games being canceled due to the delta variant. Let’s hope the games take place as scheduled.
Getting back to the equity markets, you may have noticed that the sectors that have been moving higher in the past several weeks have been limited; and only select names. This lack of broad market participation illustrates the percentage of stocks that are trading above the 200-day moving average. In today’s and yesterday's session, we have more of a broader market participation due to oversold conditions. Small-cap stocks have led the way, as they were a very oversold group heading into Friday’s and Monday’s price action.
In a healthy market, we want to see broad market participation with a high percentage of stocks trading above their key 200-day moving averages. I feel like we are close to an inflection point in the broader markets, and there are several risks that skew to the downside, more so than the upside.
From 1980 - 2019 ($SPX):
- July: +0.79%
- August: -0.15%
- September: -0.70%
The $SPX is up 1.32% in the month of July right now.
At a certain point, one would expect these factors to collide and for market participants to begin to view things differently; therefore selling the rip instead of buying the dip.
I can’t be the only one.
Want free follow-ups to the above article and details not available to 99%+ investors? Sign up to our free newsletter today!
Premium
You have reached your limit of 3 free articles for this month.
Start your subscription and get access to all our original articles.
Author

Rafael Zorabedian
Sunshine Profits
After spending years as an active trader across several capital markets, Rafael earned his stripes as a former futures and options broker specializing in equity indices, energies, metals, and soft commodities.


