S&P 500 At New Record High, Will It Break Above 2,500?

Briefly:
Intraday trade: Our yesterday's neutral intraday outlook has proved accurate. The S&P 500 index fluctuated within a relatively narrow trading range following Tuesday's advance. The market may retrace some of its recent rally today, as the S&P 500 index trades close to potential resistance level of 2,500. On the other hand, support level is relatively close, at Tuesday's daily gap up of 2,488.95-2,490.37. Therefore, we prefer to be out of the market once again, avoiding low risk/reward ratio trades.
Our intraday outlook is neutral, and our short-term outlook is bearish, as we expect downward correction. Our medium-term outlook remains bearish:
Intraday outlook (next 24 hours): neutral
Short-term outlook (next 1-2 weeks): bearish
Medium-term outlook (next 1-3 months): bearish
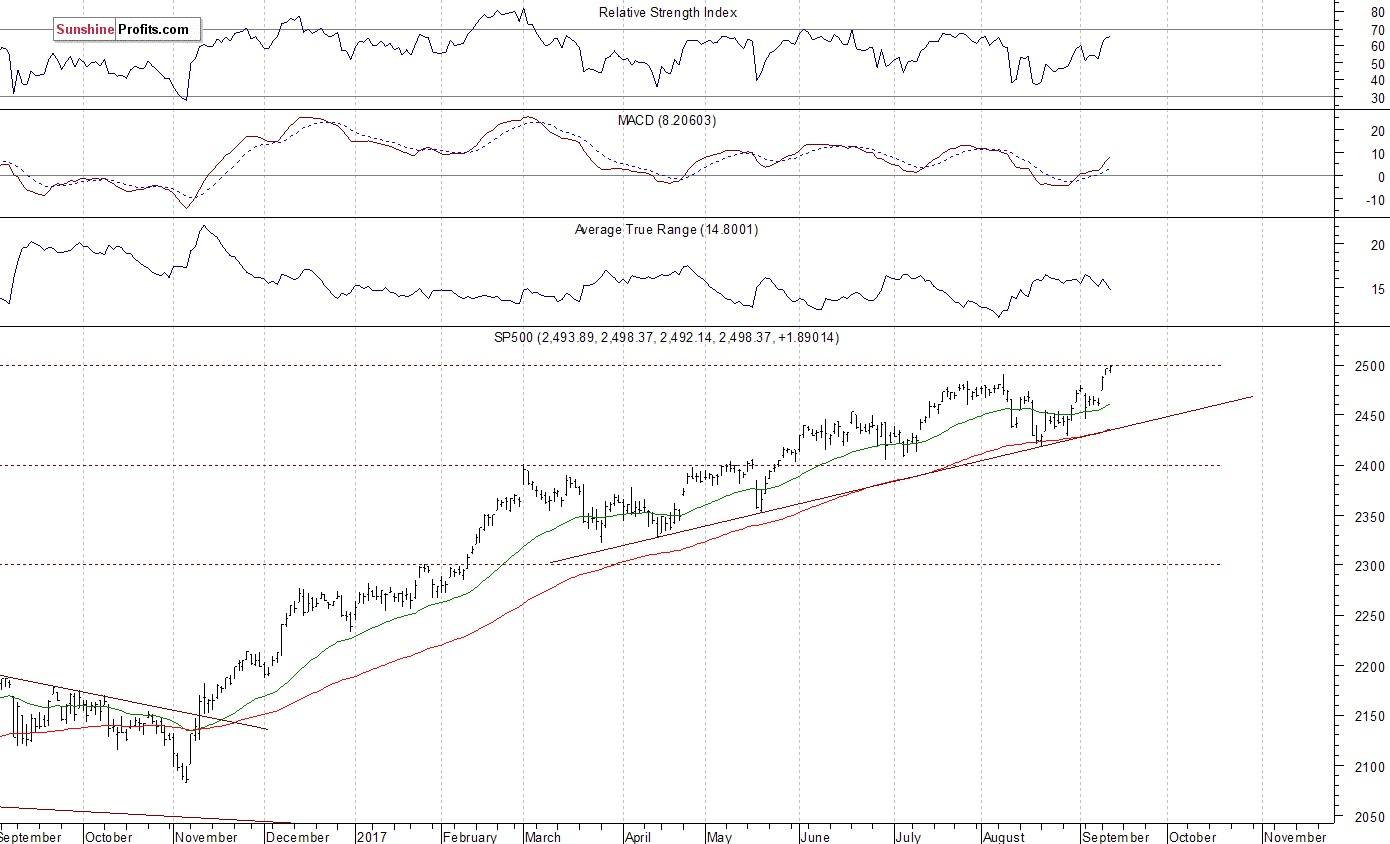
The U.S. stock market indexes gained 0.1-0.2% on Wednesday, slightly extending their short-term uptrend, as investors' sentiment remained bullish following breakout above recent consolidation. The S&P 500 index has reached new all-time high at the level of 2,498.37, almost 8 points above its previous August 8 high of 2,490.87. The Dow Jones Industrial Average remained close to August 8 record high of 22,179.1. The technology Nasdaq Composite index continues to trade very close to record high of 6,460.84. The nearest important level of resistance of the S&P 500 index is at around 2,500. On the other hand, support level is at 2,490, marked by Tuesday's daily gap up of 2,488.95-2,490.37. The next support level remains at around 2,465-2,475, marked by Monday's daily gap up of 2,467.11-2,474.52. The level of support is also at 2,460, marked by last week's short-term consolidation. The broad stock market resumed its long-term uptrend, as it reached new record high just below 2,500 mark. Will uptrend continue? Or is this a medium-term topping pattern ahead of downward correction? There have been no confirmed negative signals so far. However, we can see medium-term overbought conditions accompanied by negative technical divergences:
Sideways Intraday Action
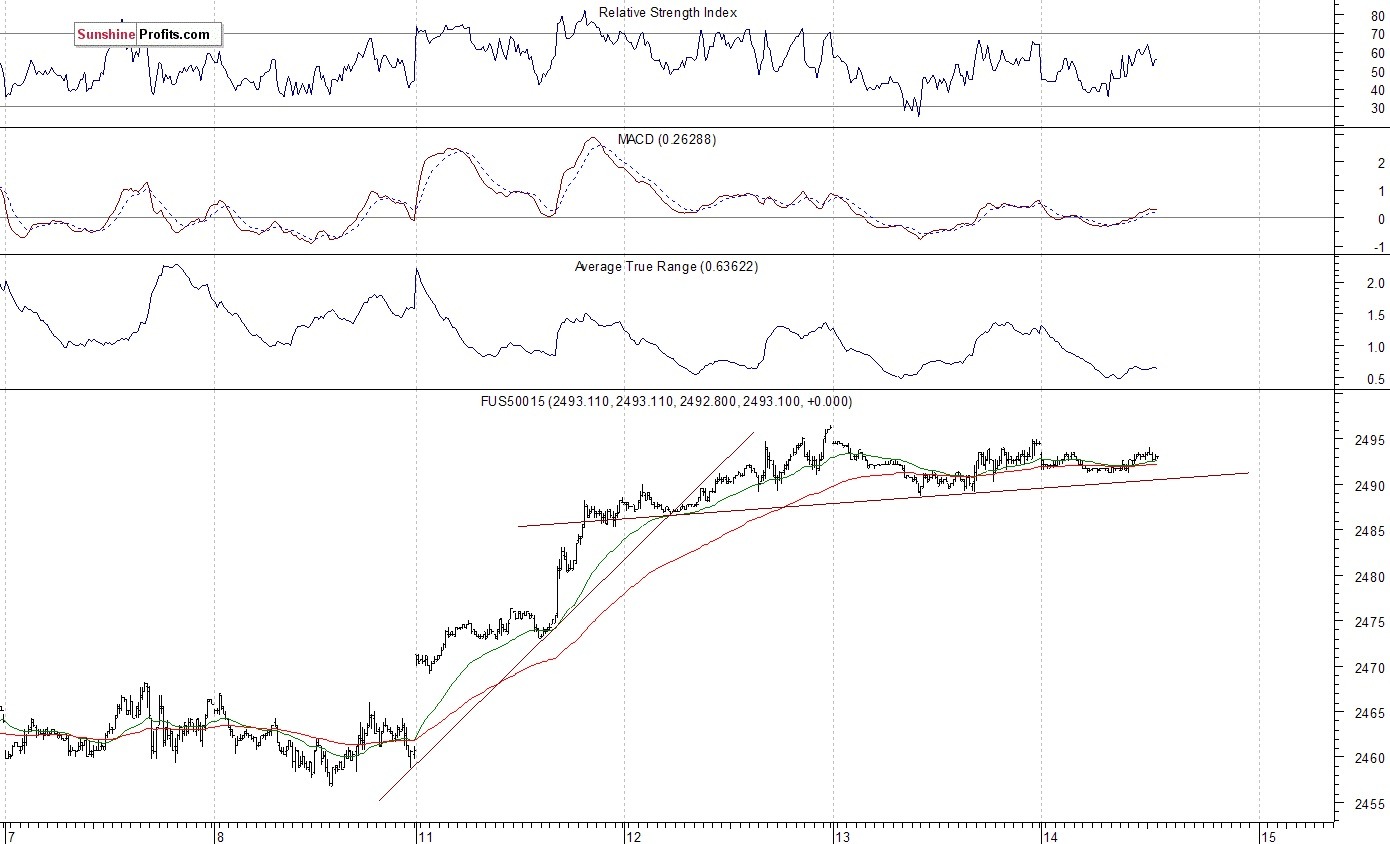
Expectations before the opening of today's trading session are slightly negative, with index futures currently down 0.1% vs. their Wednesday's closing prices. The European stock market indexes have been mixed so far. Investors will now wait for some economic data announcements: Consumer Price Index, Initial Claims at 8:30 a.m. The market expects that Consumer Price Index grew 0.3% in August, and Initial Claims were at 303,000 last week. The S&P 500 futures contract trades within an intraday consolidation following an overnight decline. The nearest important resistance level is at 2,495-2,500, marked by record high. On the other hand, level of support is at 2,480-2,485, marked by short-term consolidation. The next support level is at 2,465-2,470, among others. The futures contract trades above its slightly ascending upward trend line, as we can see on the 15-minute chart:
Nasdaq Close To New Record
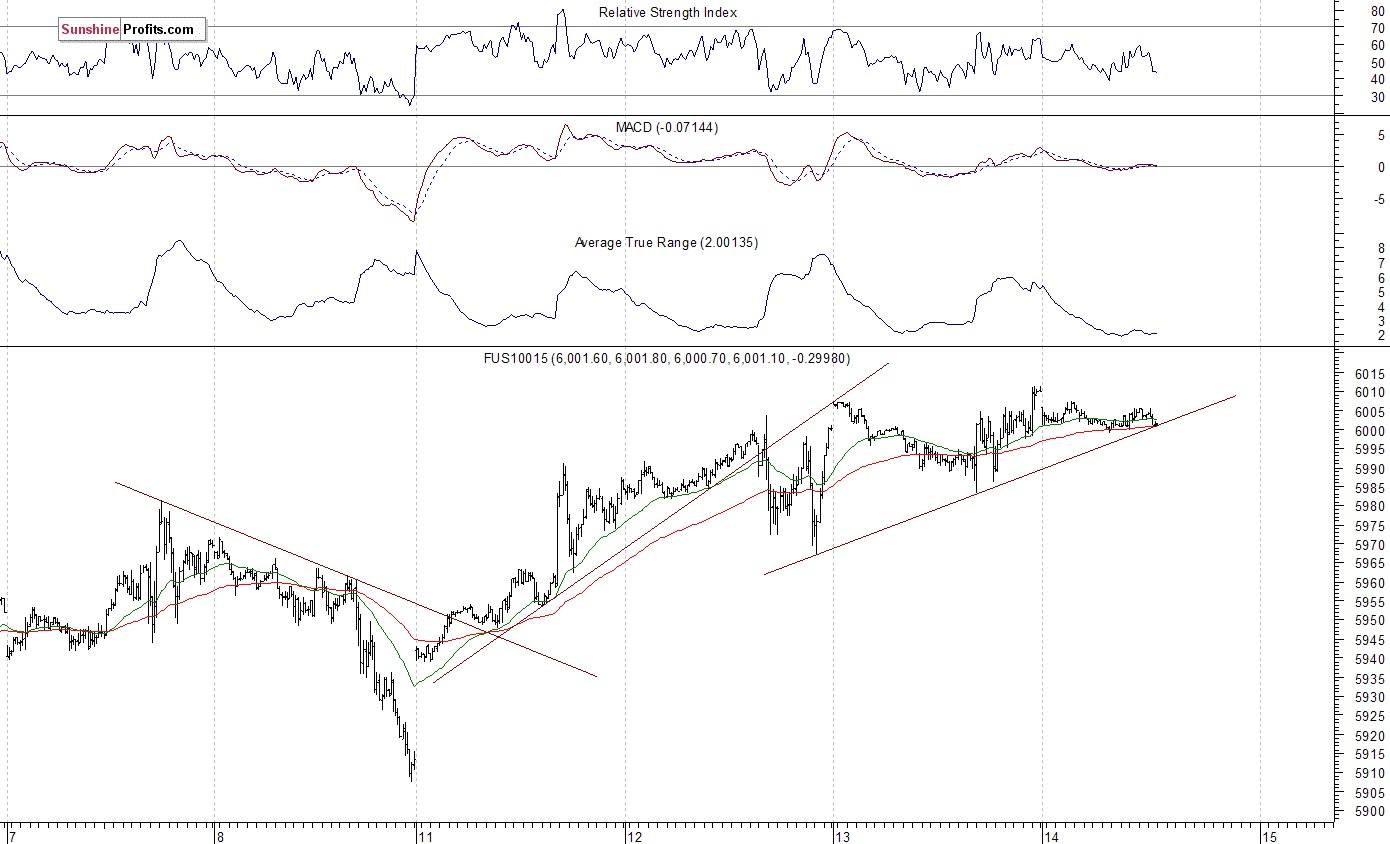
The technology Nasdaq 100 futures contract follows a similar path, as it trades within an intraday consolidation following overnight move down. It continues to trade close to its previous record high just below the level of 6,020. The nearest important level of resistance is at around 6,000-6,020. On the other hand, support level is at 5,980-5,985, marked by yesterday's daily lows. The next level of support remains at 5,960-5,970, marked by some recent fluctuations. The Nasdaq futures contract trades close to short-term upward trend line, as the 15-minute chart shows:
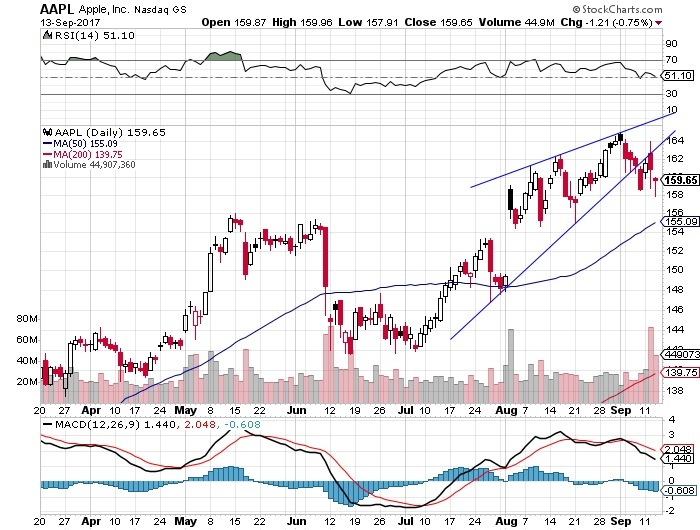
The market continued to react to Tuesday's Apple product conference. Let's take a look at Apple, Inc. stock daily chart. It remains below previously broken upward trend line or a rising wedge pattern. We still can see some relative weakness vs. the broad stock market index here:
Concluding, the S&P 500 index reached another new record high yesterday, as it got closer to 2,500 mark. Will uptrend continue? Or is this a topping pattern before downward correction? There have been no confirmed short-term negative signals so far. However, we still can see some medium-term overbought conditions along with negative technical divergences.
Want free follow-ups to the above article and details not available to 99%+ investors? Sign up to our free newsletter today!
Author

Paul Rejczak
Sunshine Profits
Paul Rejczak is a stock market strategist who has been known for the quality of his technical and fundamental analysis since the late nineties.


