Some of the more interesting charts on my radar today

It’s a quiet day on the markets today, and Asia is undergoing a pause after having to digest much political news. Not to mention having done a cracking job of bullying the Fed’s view on rates and even balance sheet normalisation.
These calm conditions provide a chance to scan the markets and the set-ups that compel.

The Fed’s balance sheet is the game changer
The first chart is one that I will focus on in next week’s webinar, as I honestly feel it is just so important for markets in 2019. The debate is on the Fed’s balance sheet, and if I look at US excess reserves (green line – inverted) relative to the US dollar index (USDX), we can see the impact excess reserves, driven by changes in the Fed’s balance sheet, has on the USD. I have put a lag on the USD by a number of months, so it highlights that when excess reserves decline the USD will strengthen after a period of time.
While we are all fascinated on where to for US rates, if you understand where the balance sheet is going you will likely get your USD call correct.
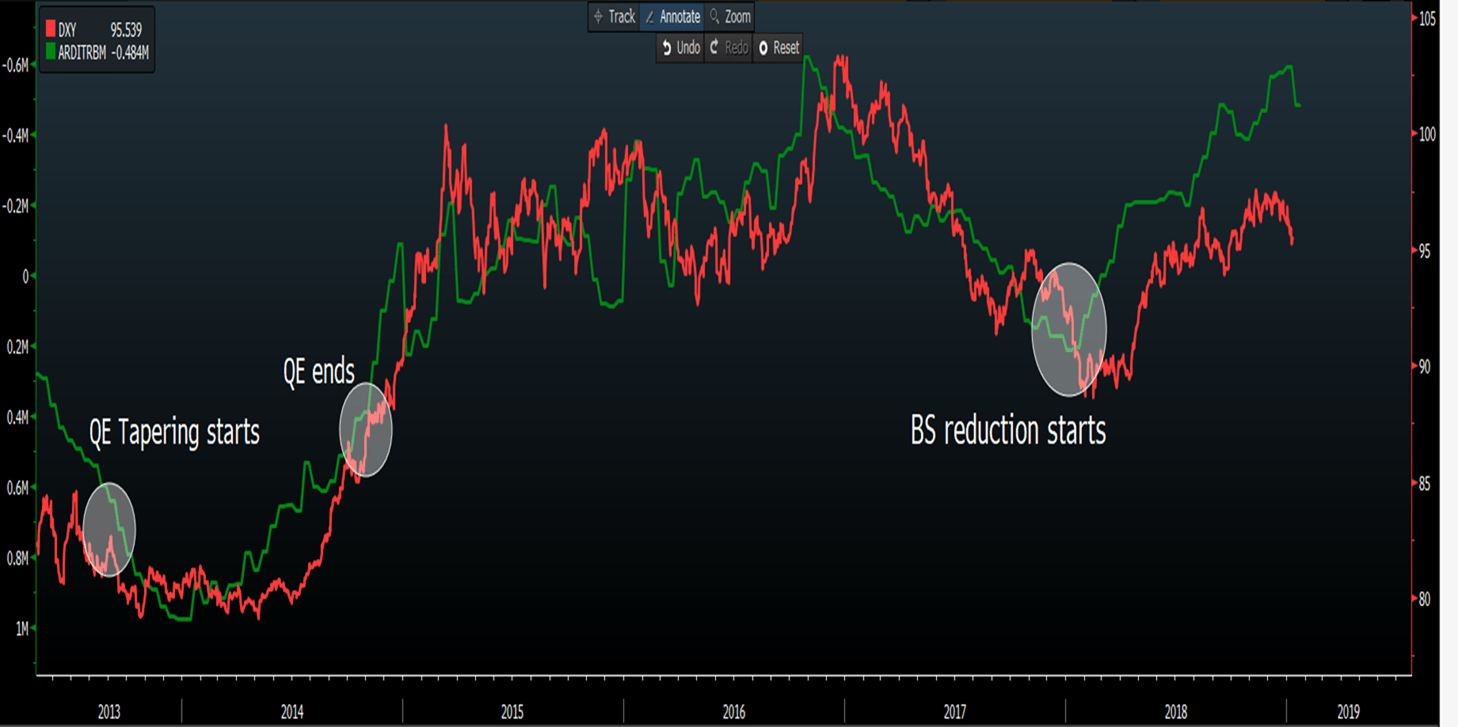
(Source: Bloomberg)
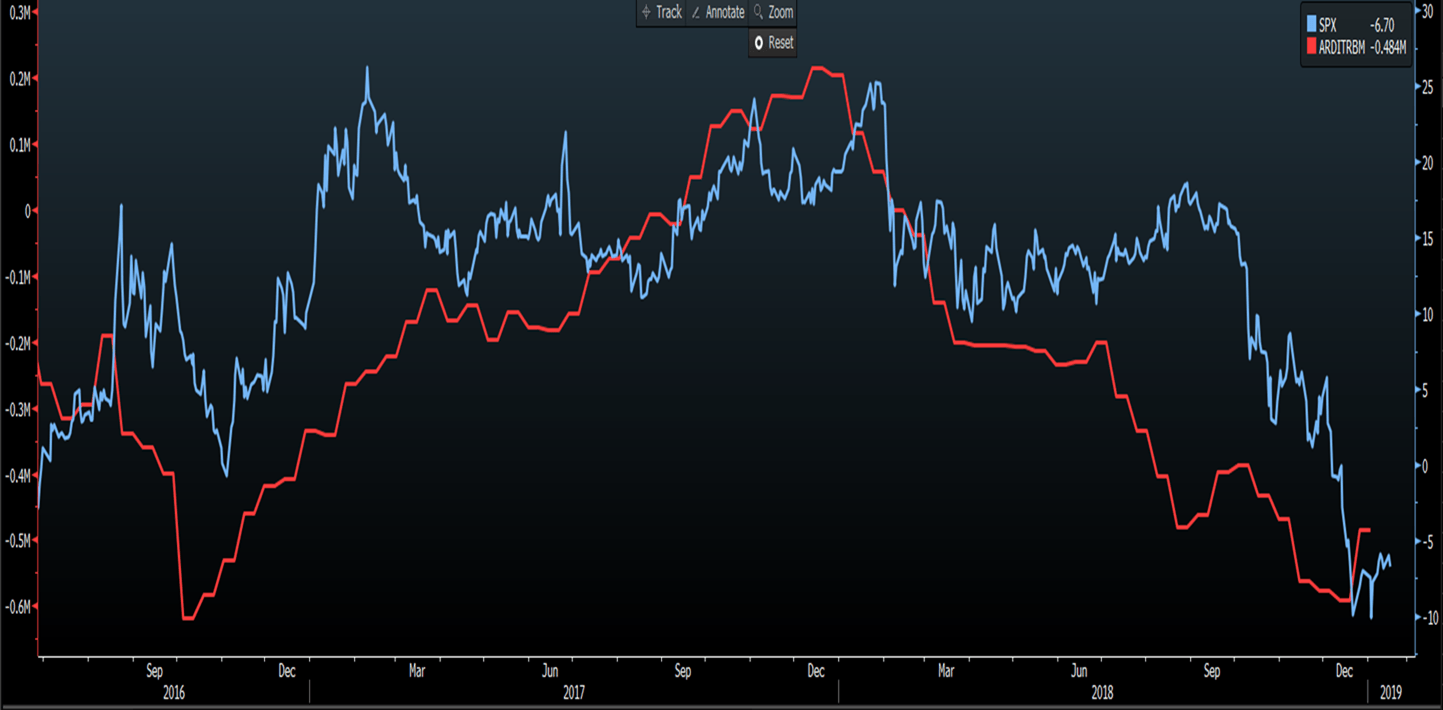
US 500 – The bulls have had a better say since 24 December, and while most feel this is due to the Fed moving closer to the market and indicating a pause in their hiking cycle. However, if I scan the YoY change In US excess reserves (red), we can see the pace of decline reversed in December. I have overlapped this against the performance of the S&P 500 (blue). Once again, the market, it seems, is being driven by excess reserves and, of course, liquidity.
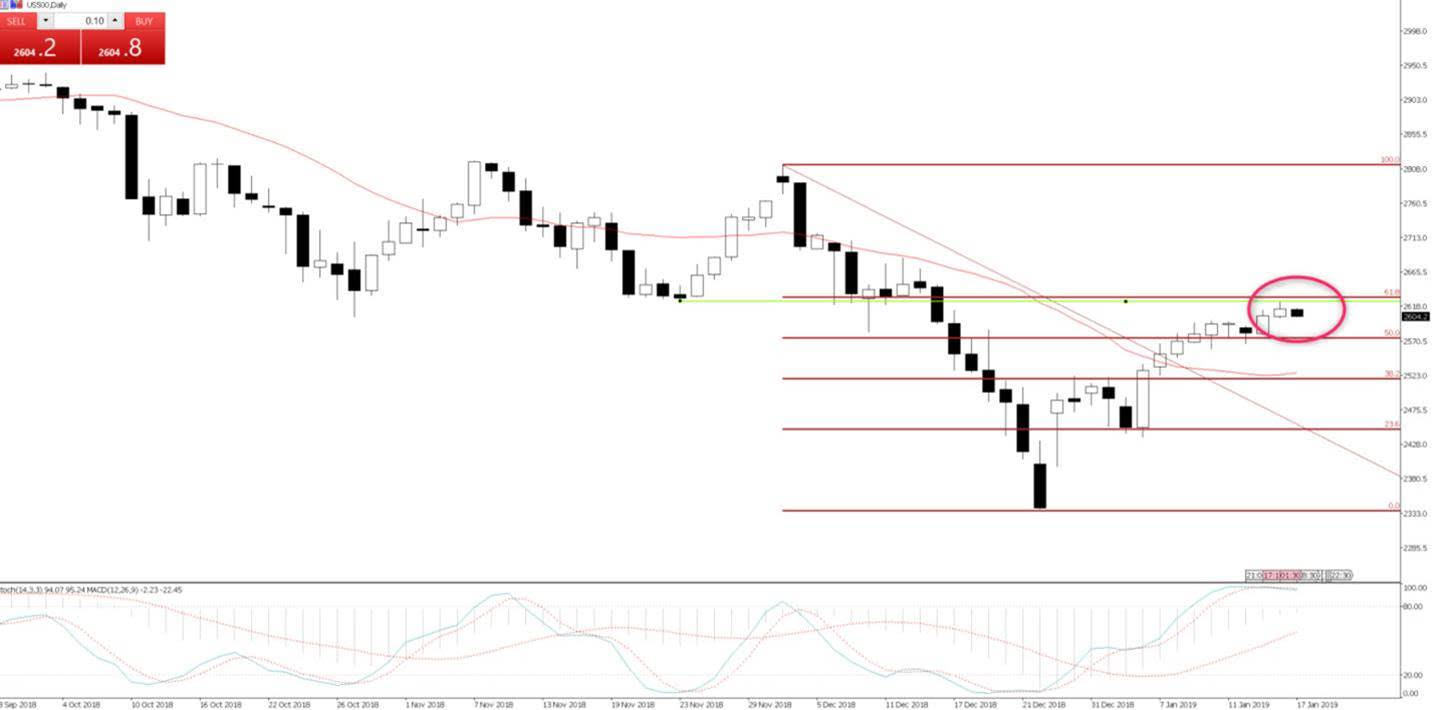
US 500 daily - Price has rallied to test the 61.8% fibo of the December sell-off but is lacking the impetus to push through here just now. That said, price is currently holding above yesterday’s low of 2601.7, while we continue to see stochastic momentum at extremes, but haven’t had a bearish signal from this oscillator as yet. However, it may come soon and this should be respected. A close through 2648 would suggest this rally continues in earnest, and much of that will be determined by the US corporate reporting, which is well underway, and as we have seen changes in excess reserves.
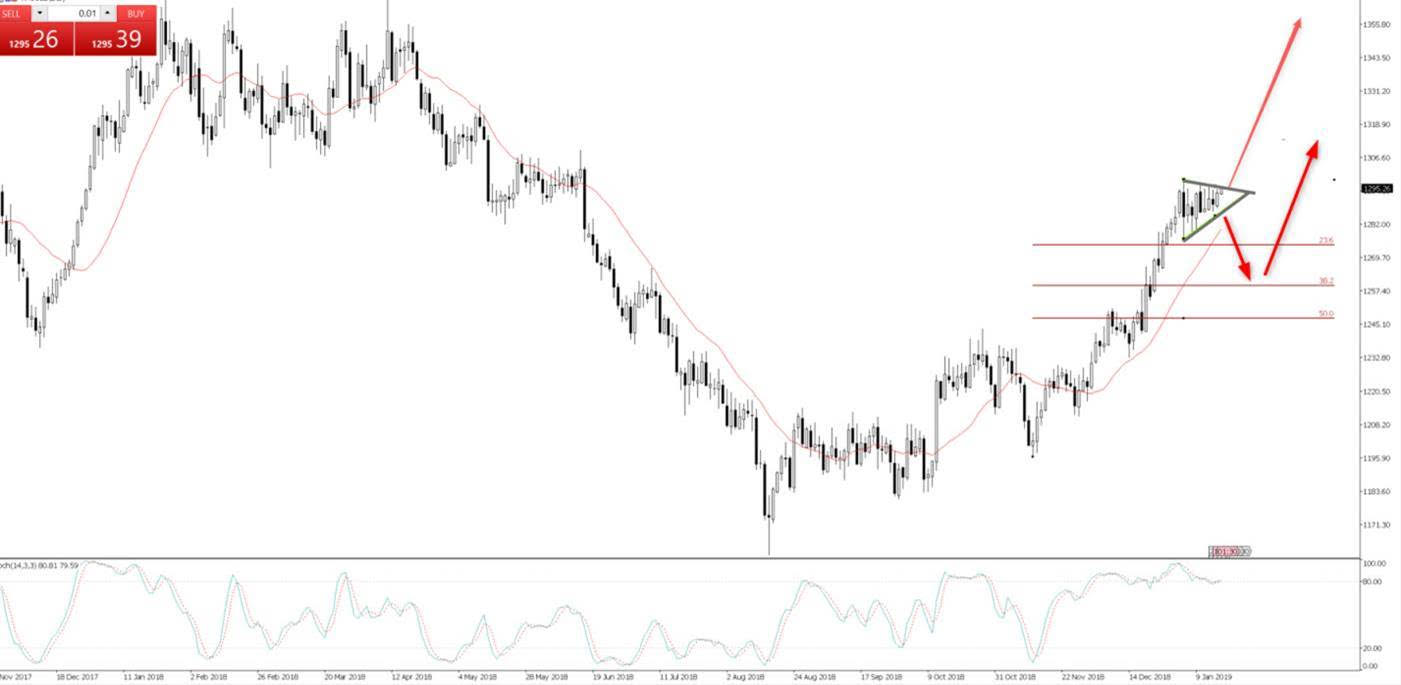
Gold (XAUUSD) – Price is consolidating in a pennant pattern, where 75% to 80% these consolidation patterns will resolve in the direction of the prevailing trend, which we can see is bullish. Let price guide here, but a bearish break and I see price declines into $1274 coming into play, but no lower than $1259, where it should turn higher. An upside break and $1300 should come into play.
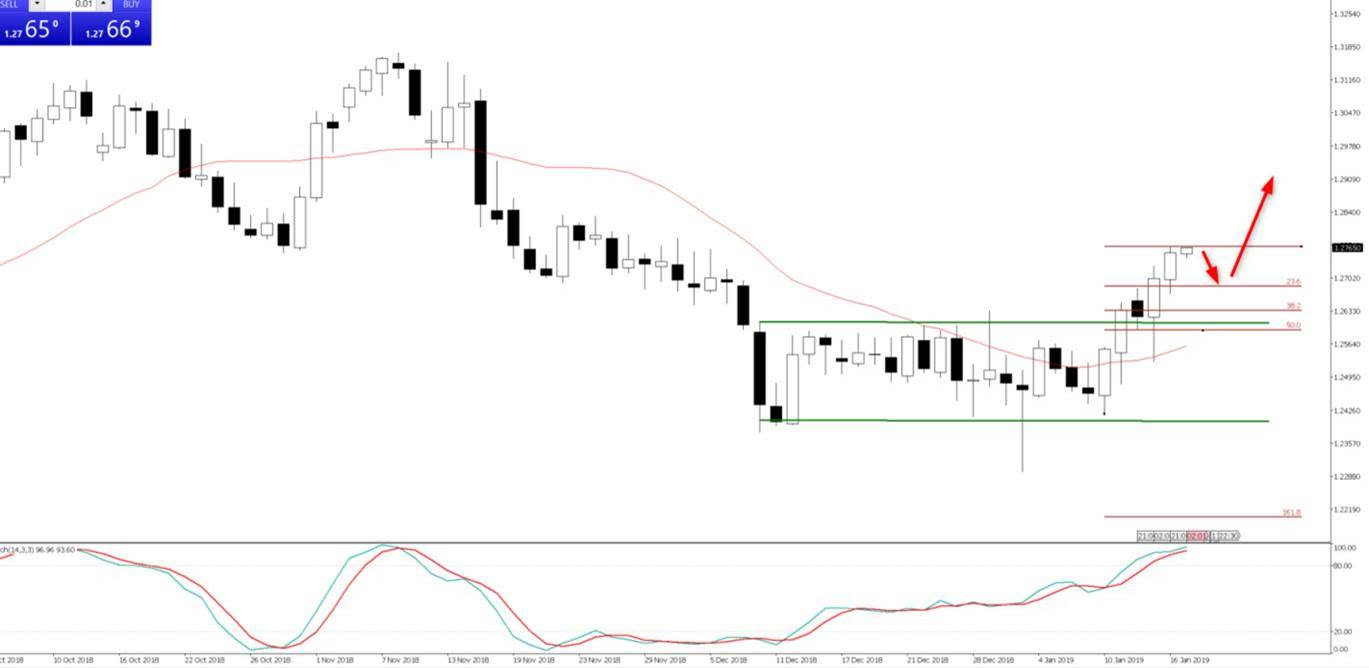
GBPUSD – a crowd favourite at present given the circus that is the UK political arena. The chart tells me all I need to know here, and the price is happy to oscillate higher in a bullish channel. Downtrend resistance (drawn from the September high) kicks in at the top of the channel, so we have a confluence of resistance levels into $1.2990/$1.3000, married with extreme reads in the stochastic momentum. Expect sellers here, and this looks an interesting level for swing traders to work orders into.

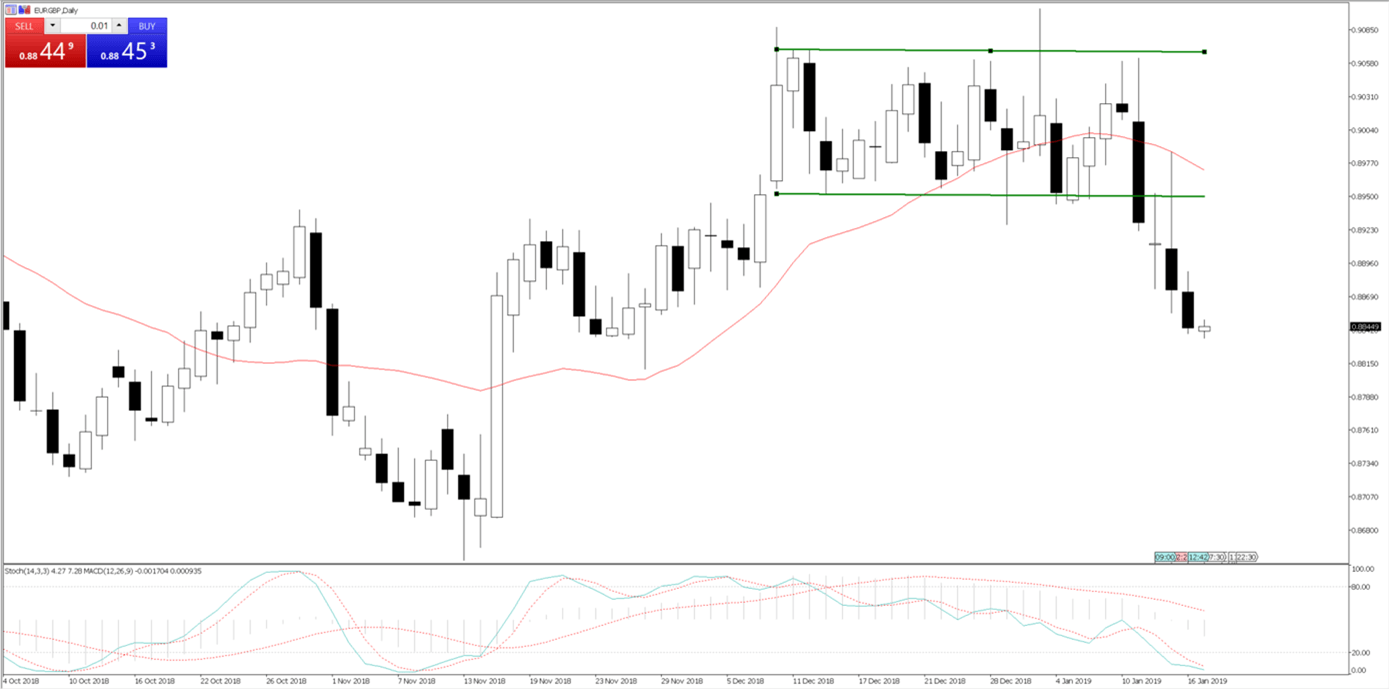
EURGBP – I looked at this set-up earlier this week and felt selling rallies into 0.8910 looked a more compelling risk-to-reward trade-off. Again, we see momentum oscillators at extreme’s, but, if short I would stay short as the trend is strong and tightening stops seems prudent. EURGBP one-week risk reversals sit at 0.10x, which tells me the demand for calls and puts are roughly balanced. The neutral sentiment in the options market is clearly not reflected in the spot price, which is looking like it could attract more trend-following capital.
GBPCHF - Another GBP bullish set-up, so, again it’s hard to have too much exposure to the currency as the GBP continues to be beholden to headlines. That said, price has firmly broken out of the 1.26-1.24 range it held through December to January and looks to head higher. Happy to hold longs here, with stops through 1.26693.
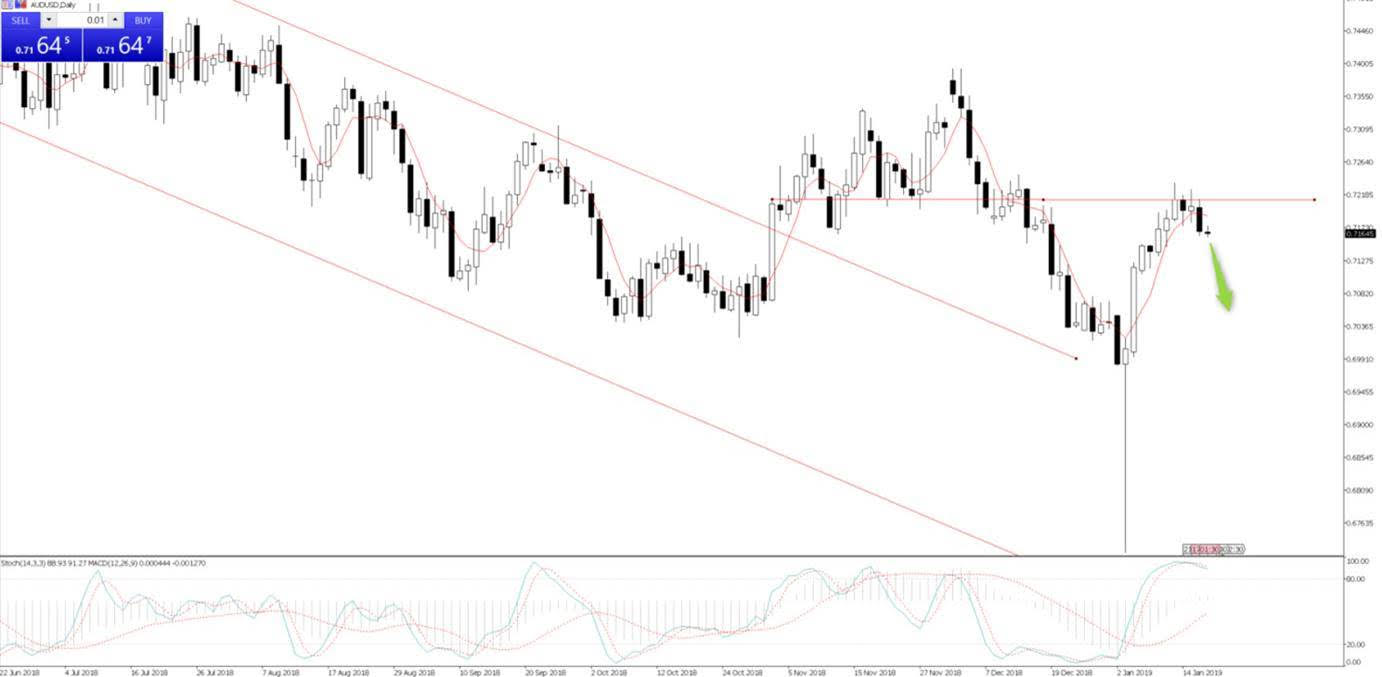
AUDUSD – a chart I highlighted yesterday and a look at the price action and we’ve seen the selling accelerate. Yesterday’s candle was bearish, but there has been some indecision to push price through yesterday’s low today here in Asia today. Its early days and the lack of vol in Asia is hardly inspiring FX traders, but a break of 0.7168 and we should see 0.7130 come into play relatively soon.
Author

Chris Weston
Pepperstone
Chris Weston recently joined Pepperstone as Head of Research.
More from Chris Weston


