Silver’s Not-so-subtle Outperformance

Silver soared recently and white metal’s rally was accompanied by a huge volume. Those who are new to the precious metals market will probably immediately view this as bullish as that’s what the classic technical analysis would imply. Silver is not a classic asset, though, and classic measures often don’t apply to it. One way to check the real implications of a given development is to examine the previous cases and see what kind of action followed. That’s what we’re going to do in today’s free analysis. Let’s start with silver’s daily chart.
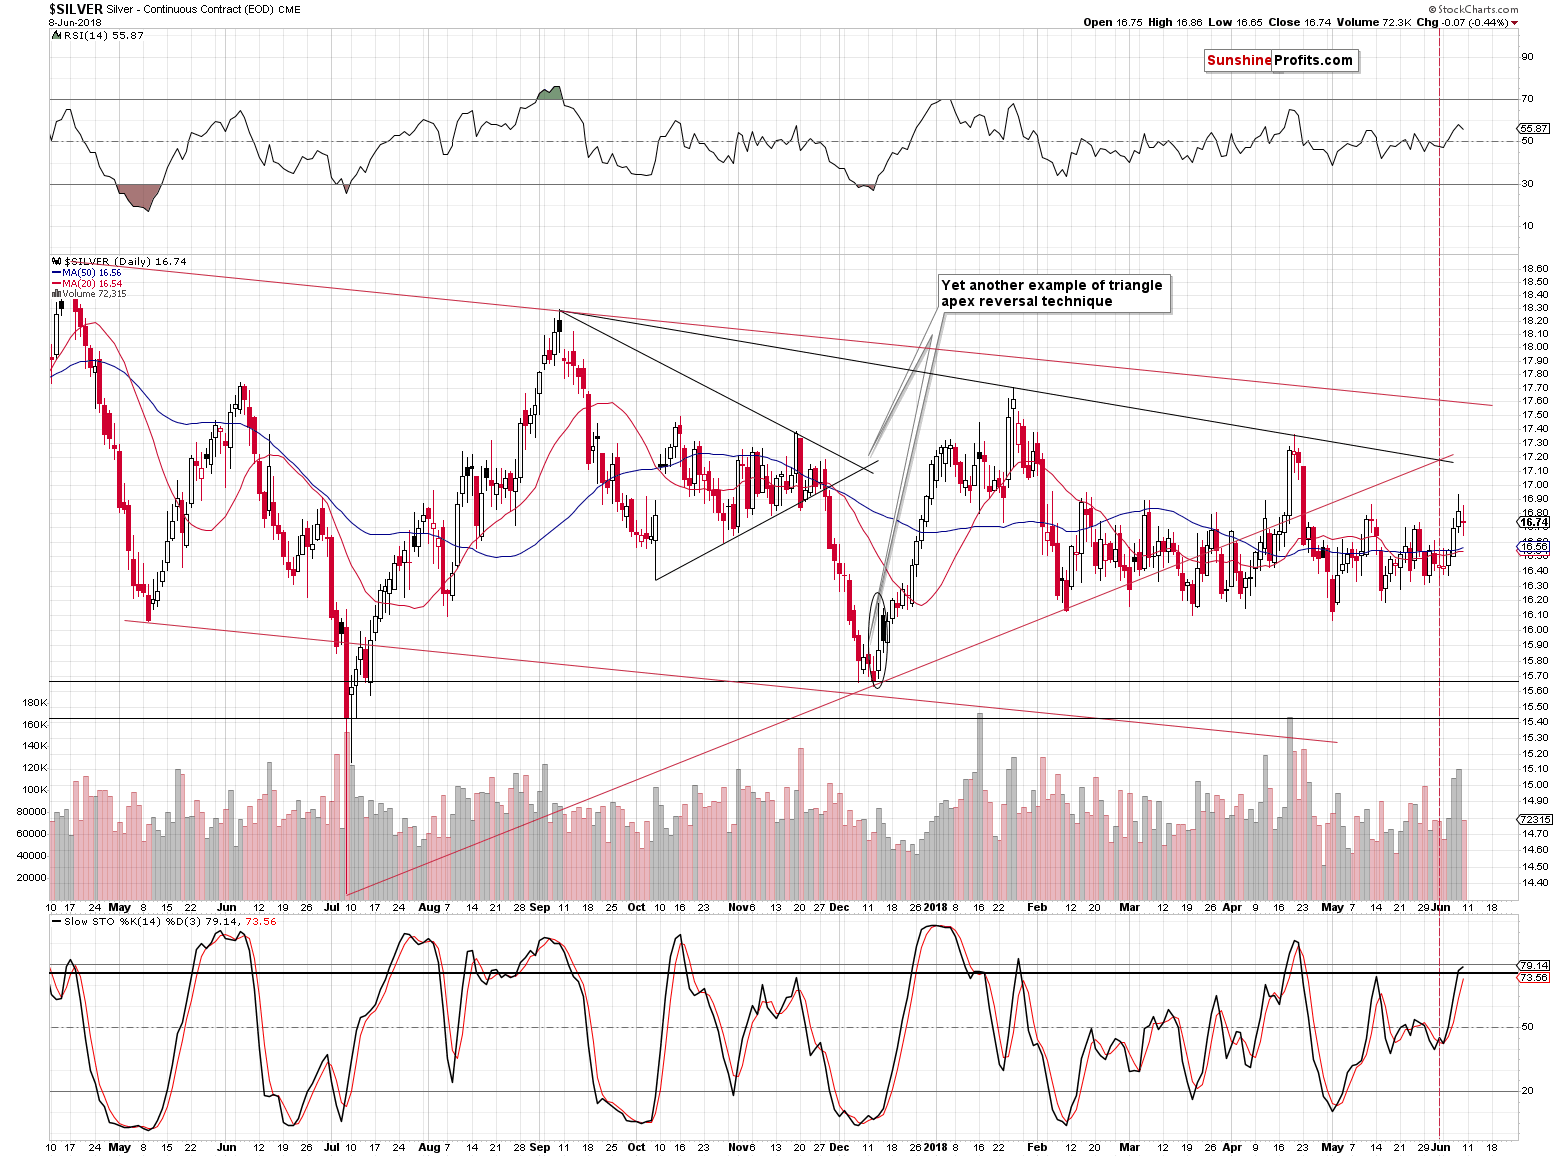
Before Wednesday’s and Thursday’s rallies, the upswing in silver didn’t seem significant at first sight, but the size of the volume suggested that we may have seen something important. It was not spectacular, but it was big when one compared it to the size of the volume in gold. The yellow metal moved higher on low volume, but what we saw on Tuesday in silver was rather average. Could it have been the case that the silver price action was somehow meaningful in relation to gold?
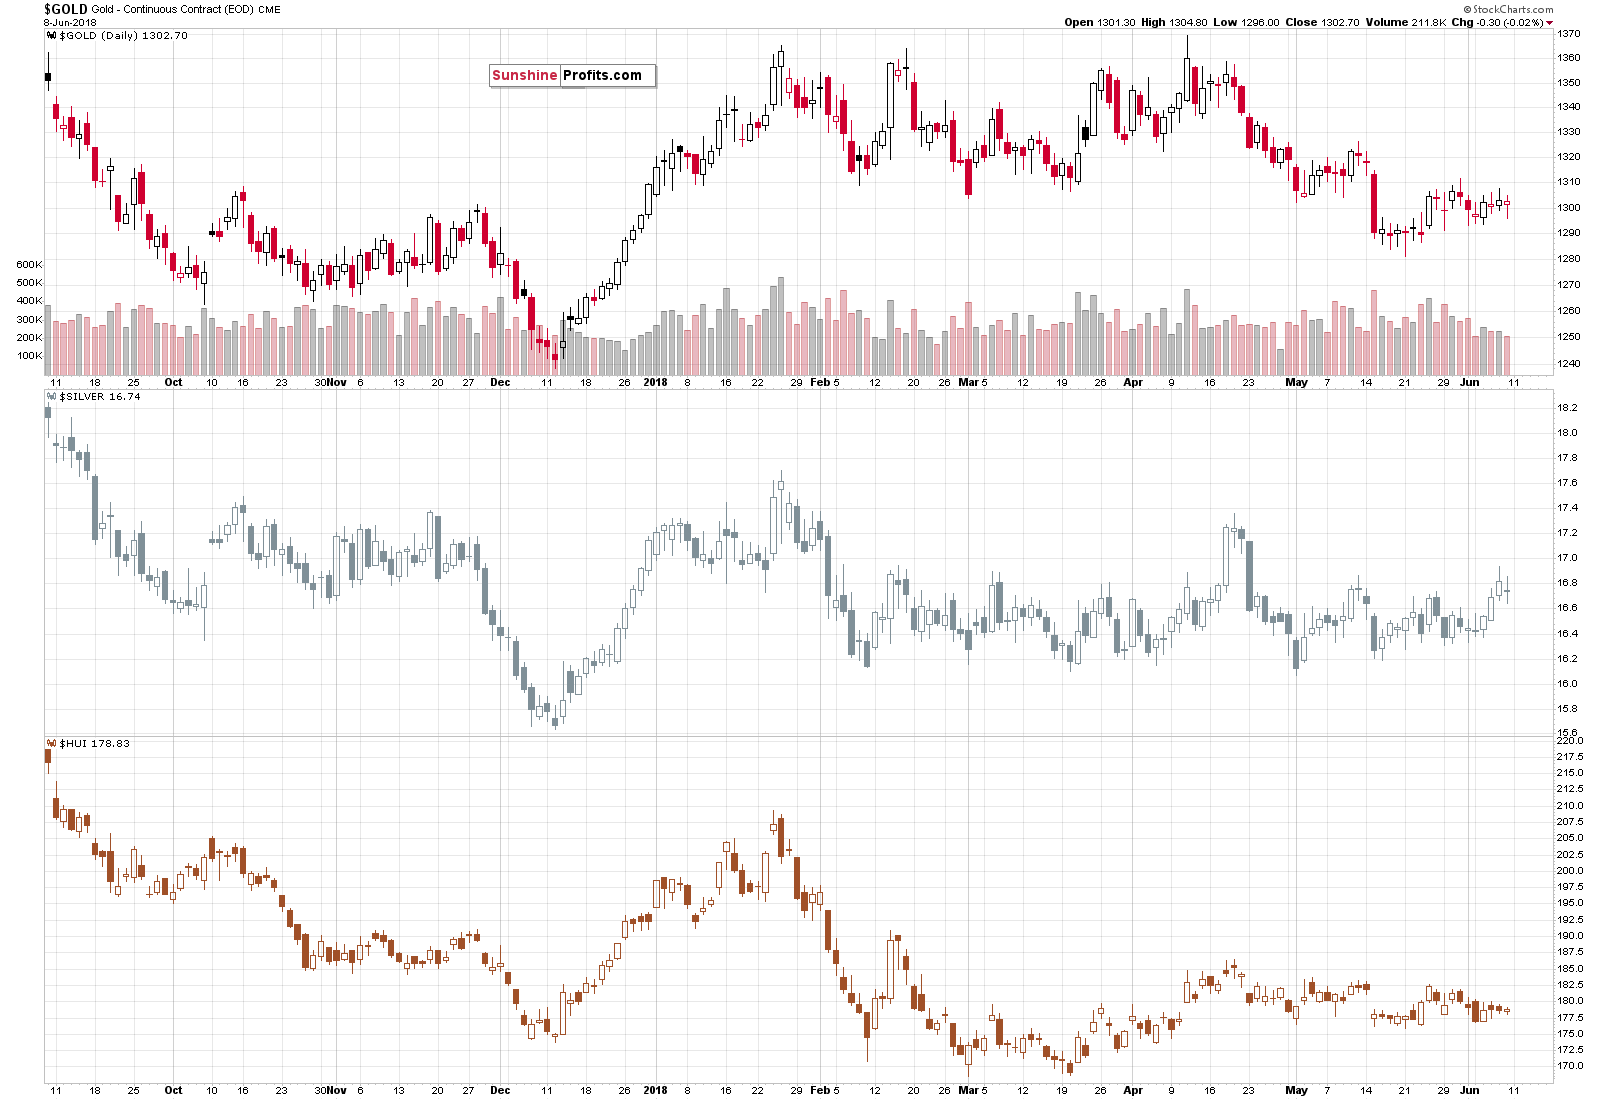
On a day-to-day basis, it didn’t appear significant, but when one considers the previous 5 trading days, they will see that gold was lower than it had been, gold stocks were lower than there had been and that they underperformed gold, whereas silver was more or less where it had been before.
This means that silver has indeed outperformed gold, while gold stocks underperformed. The signal was not as clear as if we had seen this kind of outperformance and underperformance on a single day, but it was definitely meaningful.
As a reminder, silver’s outperformance and mining stocks’ underperformance is something that we usually see right before the declines.
Ok, but why are you guys discussing something that happened several days ago?
Because it makes the following signals even more profound. The above is a bearish foundation on which even more bearish signals emerged and confirmed it. Taken together, they paint a picture that’s clearer than it would be without the above-mentioned details.
What we saw on Wednesday and Thursday, were daily confirmations of the 5-day pattern. It was as clear as it gets. Silver rallied, while gold and miners practically didn’t move. The implications are very bearish for the short term. In fact, as odd as it may sound, they are much more bearish than they were before silver’s rally.
As we’ve often stated, just because a price moved higher doesn’t mean that it’s likely to move higher again. This seems to be the most natural way of viewing the market by the beginning investors and traders, but the reality is much more complex. A simple fact that negates the above is that in order to make profits, one needs to buy low and sell high. The price is high after a rally, so based on the above approach alone, one would never be able to sell at or close to a top.
The opposite – viewing rallies as bearish – is only a little better but it’s still wrong overall. The key is to look at the context and only make a decision whether a move is bullish or bearish, once it’s been properly analyzed.
Moving back to silver, some may say that given the above tendency of the white metal to outperform, silver could rally for much longer and thus we should close the trading positions right away and re-enter them after silver already declined, proving that the top is already in.
This sounds good in theory, but in practice, the sharp upswings are very often followed by even sharper declines and it’s very difficult to get a better price during a decline, so ultimately the above trading technique is more likely to decrease profits instead of increasing them.
On Thursday, silver repeated its Wednesday’s rally despite lack of thereof in gold and miners, which further confirmed the bearish implications.
If we consider different source of data, we see that silver actually reversed before the end of the day and closed the session only a few cents higher.
Some may say that the above implies that after all there was no outperformance yesterday. Indeed, overall, there was none, but there was clear outperformance during the intraday rally and that’s enough to serve as a confirmation of the previous days’ bearish signals and further emphasis of their importance.
Since silver actually reversed, it should be particularly useful to look at the volume levels, as big volume levels confirm the bearish nature of a reversal, while weak volume invalidates it. As you have seen on the previous chart, the silver volume was huge. The last time when we saw silver rally on such significant volume, was in late April 2018. Yes, that was practically right at the top (it was top in terms of daily closes, but the price moved a bit higher on an intraday basis on the following day). Big slide followed shortly, so the implications here are also very bearish.
But maybe that was just a coincidence? What about other big-volume daily rallies?
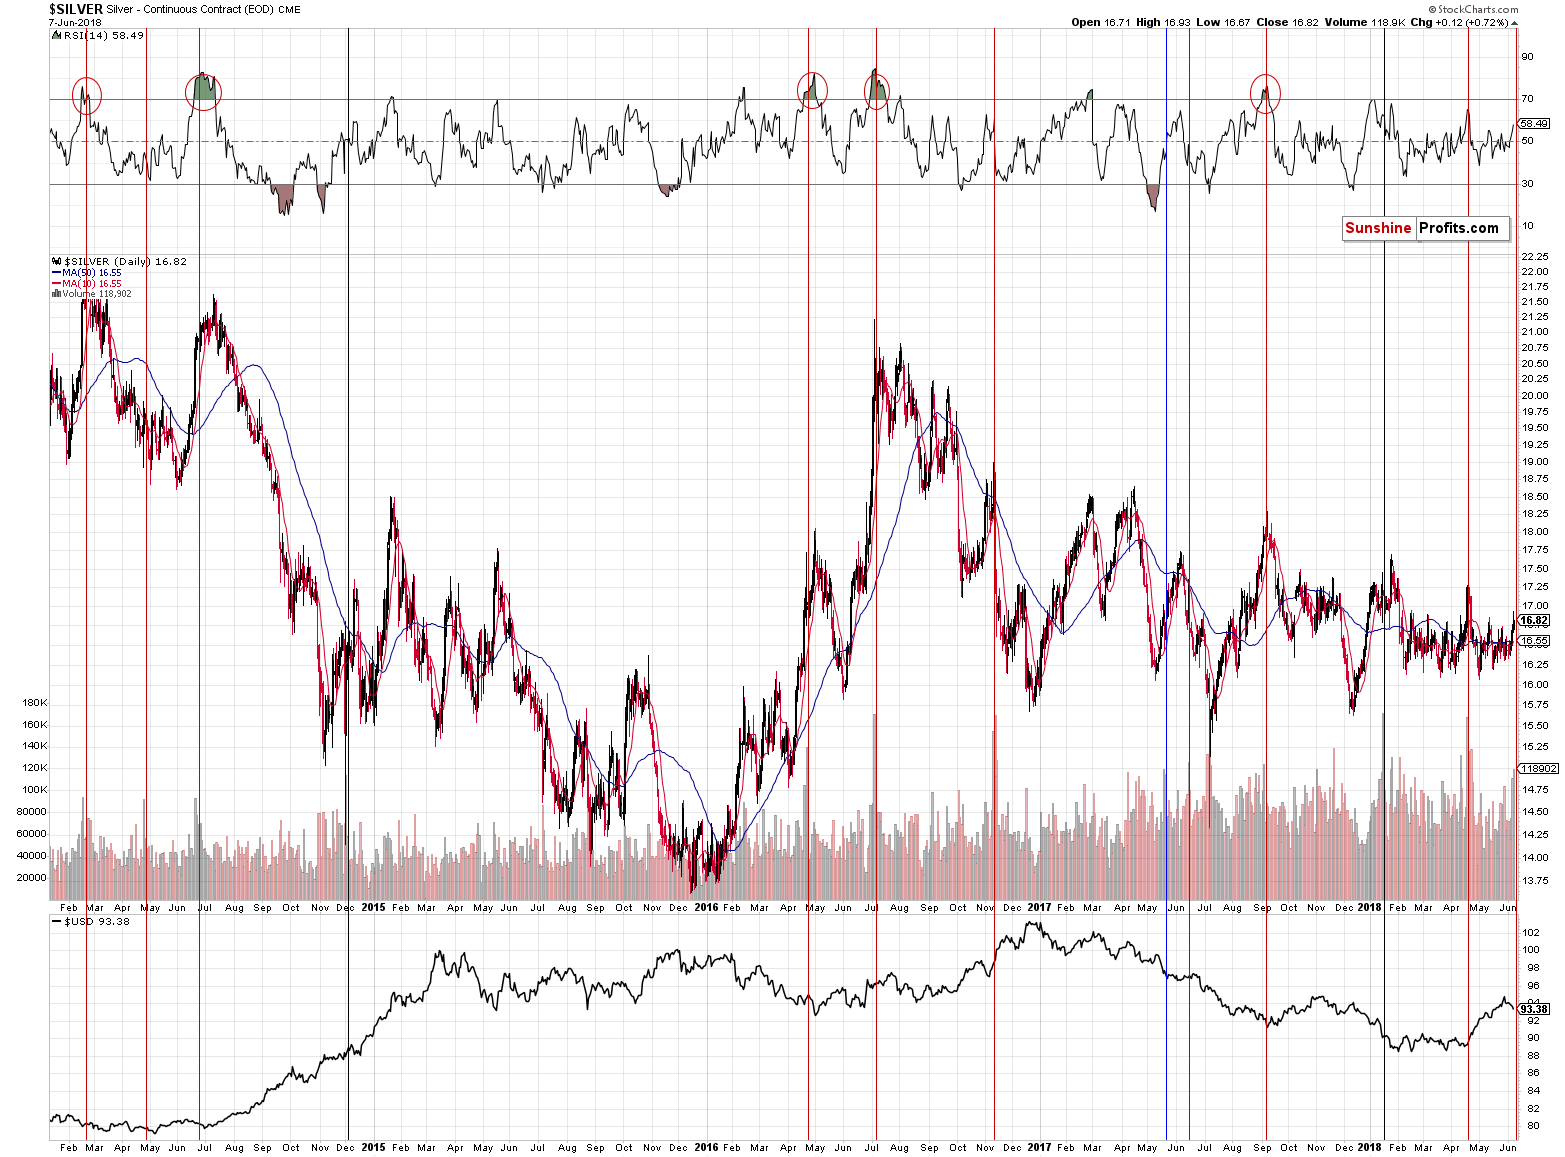
In 9 out of 12 recent cases, big volume during daily rallies meant excellent shorting opportunities (marked with red). In 2 cases it was unclear whether it was an opportunity to go short or long (marked with black), but in both cases entering a short position at that time and keeping it for about 3 weeks would have been profitable. In the remaining case that we marked with blue, silver moved higher but only for 2 weeks – it declined then and if one simply kept the short position intact, for a few more weeks, they would have made sizable gains.
Overall, the implications of a volume spike during a daily rally are clearly bearish… And this doesn’t even take into account the outperformance factor or the shape of the session, which seems to have been a reversal. Factoring in both makes the outlook for the next weeks even more bearish.
Summing up, the recent upswing in silver was not a bullish sign, but a bearish one. Moreover, let’s keep in mind that a small short-term rally was something quite possible in the light of the analogies to what happened in gold and silver when the market was just as boring as it’s been recently. It seems that we have already seen this small rally. Silver outperformed and miners underperformed, just like they are likely to in the final parts of a rally. Therefore, the outlook for the precious metals sector is bearish. In our opinion, it seems best to limit one’s exposure in their gold and silver portfolios.
Want free follow-ups to the above article and details not available to 99%+ investors? Sign up to our free newsletter today!
Author

Przemyslaw Radomski, CFA
Gold Price Forecast
Przemyslaw Radomski, CFA (PR) is a precious metals investor and analyst who takes advantage of the emotionality on the markets, and invites you to do the same. His company, Sunshine Profits, publishes analytical software that any


