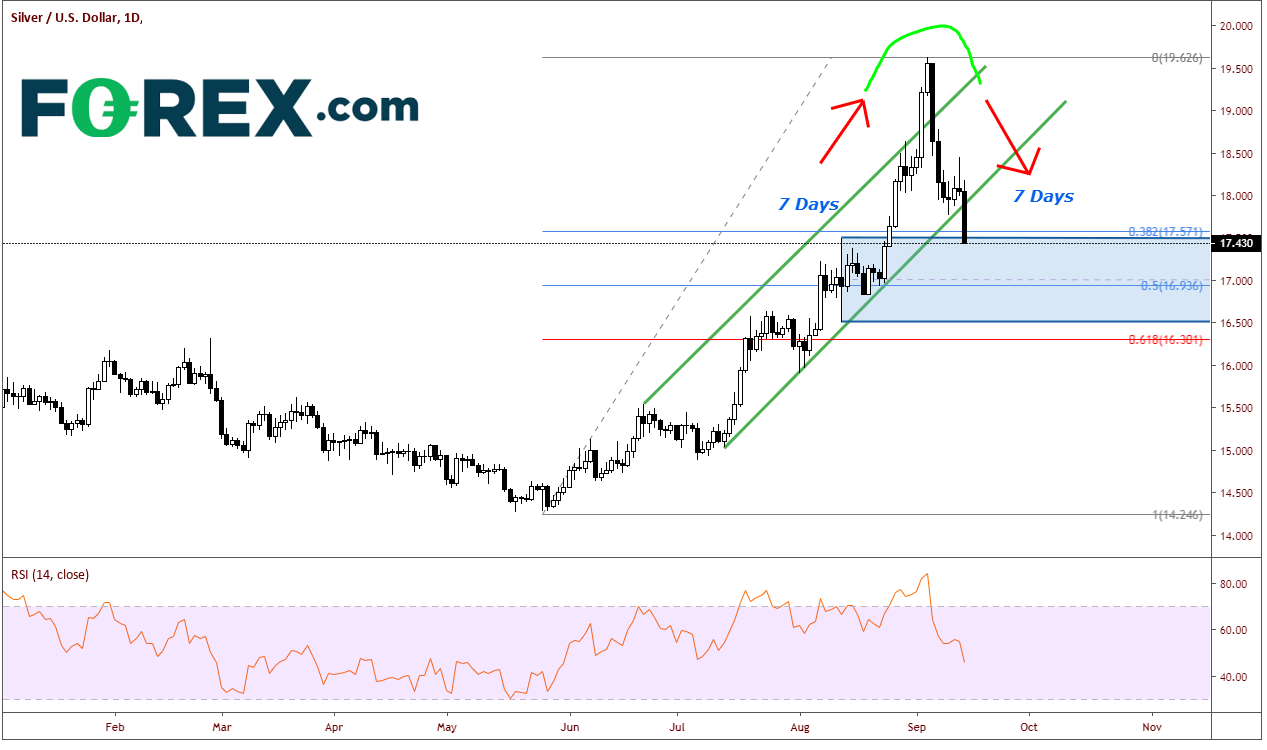
Silver wins the Gold for Biggest Loser

Silver closed down almost 3.5% today near 17.50 as it continued its selloff from the blow off top at 19.62. The precious metal is down nearly 10% since September 4th.
Source: Tradingview, FOREX.com
Silver had been in an uptrend since mid-June. On August 27th, silver opened at 17.63 and began rising towards the top of the channel trendline. Once it broke the rising trendline, it rapidly moved to 19.60 on September 4th. Silver opened on September 5th and reversed, selling off just as quickly as it bid up. This is called a blow-off top and many times occurs because of FOMO (fear of missing out). It then moved lower into the rising channel, thus creating a false breakout. Many times, if a false breakout occurs on one side of the channel, price tests the other side of the channel, which is what happened here. Today, price broke below the channel and closed near 17.50. Interestingly, the move higher from 17.60 to 19.60 took 7 trading days. The selloff from those highs back to todays 17.50 area took 7 trading days. This entire move was extremely symmetric.
Silver has pulled back to the 38.2% retracement level from the lows on May 27th to the highs on September 4th. It now sits in a large support range between 16.50 and 17.50.
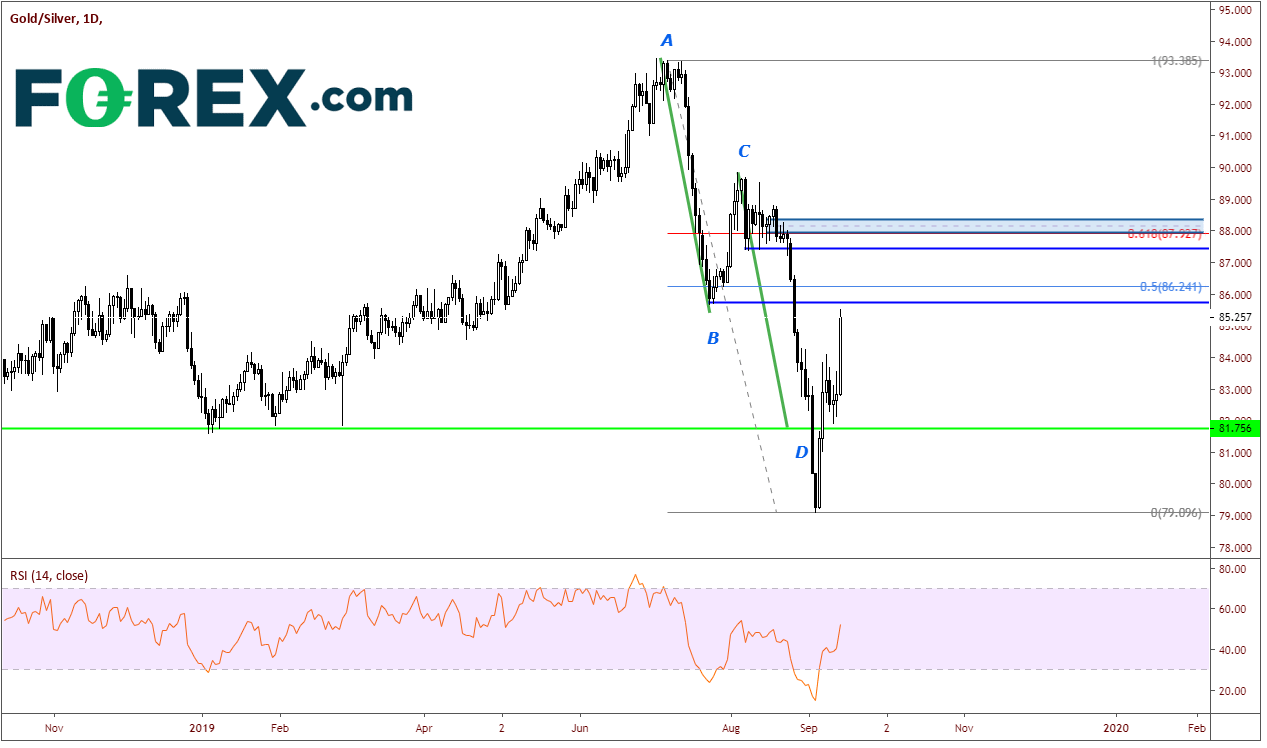
On a daily chart, the Gold/Silver ratio put in an AB=CD move. Price overshot the target with the breakout of Silver and has since reversed, running into previous support (which now acts as resistance) near 85.50. The next strong resistance level comes in between 87.50 and 88.30.
Source: Tradingview, FOREX.com
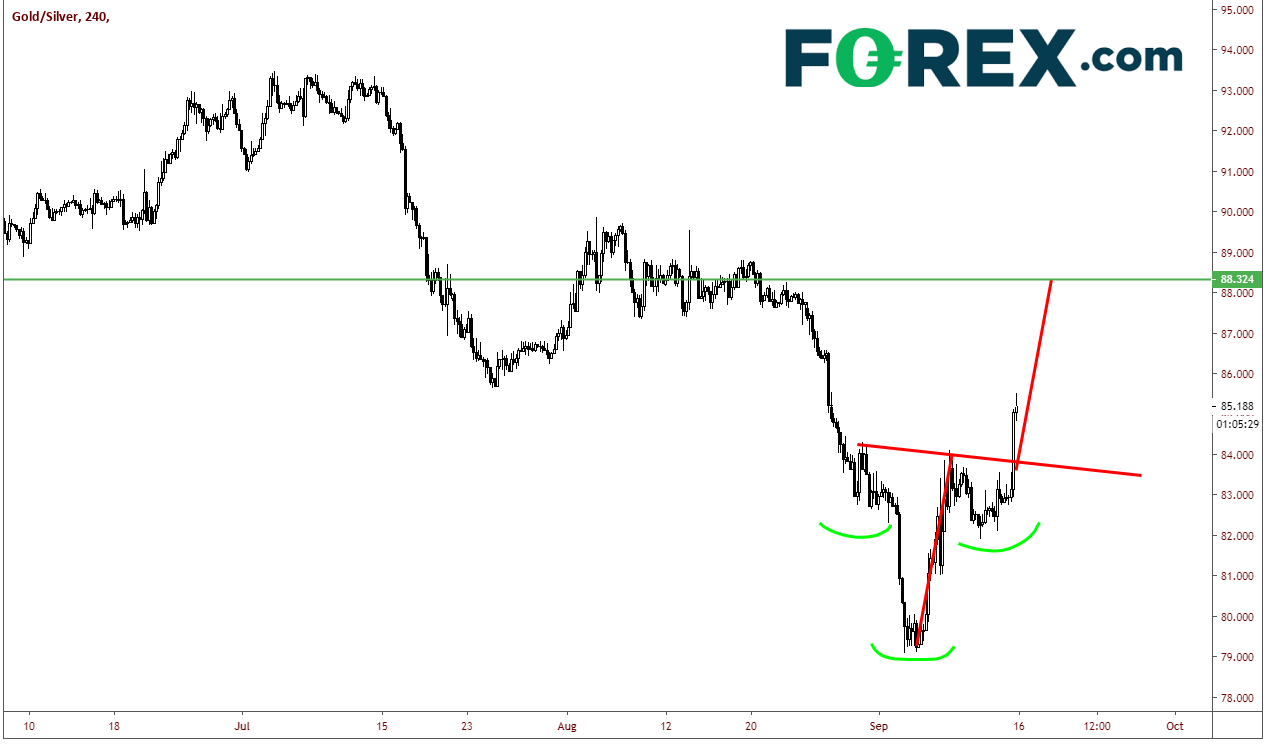
On a 240-minute chart, the gold/silver ratio has put in an inverted head and shoulders pattern and has broken the neckline today. To get the target for this formation, take the distance from the neckline to the head, and add it to the breakout level. The target is near 88.30.
Source: Tradingview, FOREX.com
If the Gold/Silver ratio were to reach the 88.30 level:
1) Gold would have to move higher at a faster pace than Silver
Or
2) Silver would have to drop at a faster pace than Gold (as it has been doing)
Watch over the next few trading days for the possibility of Silver to continue moving lower toward the lower end of support zone at 16.50, which could also push the Gold/Silver ratio higher. Resistance in Silver comes in at September 10th low near 17.75.
Author

Forex.com Team
Forex.com


