Silver should outperform with break lower in gold-to-silver ratio

Gold-to-Silver Ratio is simply gold price divided by silver price. After spiking to all-time high at 126.4 on March last year to 126.4 due to the fear of Covid-19 pandemic, it has turned lower considerably. The average ratio in 300 years history is around 30 as the chart below shows:
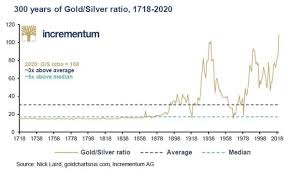
The natural ratio in the earth's crust, according to some mining producers, is around 8 to 1. That means every 1 ounce of Gold mined, there is 8 ounces of silver. If one just simply uses the average ratio of 30 to 1 and apply to the current price gold, that suggests the price of silver should be $1820 (per February 4, 2021)/30 = $60. Yet, the price of silver today is only $26 which suggests the metal is undervalued.
This week, due to the rumor of the Reddit community trying to target Silver, the metal has spiked 10% over the weekend and take out last year's high of $29.8. It has since completely reversed the spike, but nonetheless the break above last year's high carries significant technical implication. Gold-to-Silver ratio has also broken lower creating a bearish sequence since last year as the chart below shows.
Gold-to-Silver (GSR) Ratio Elliott Wave Chart
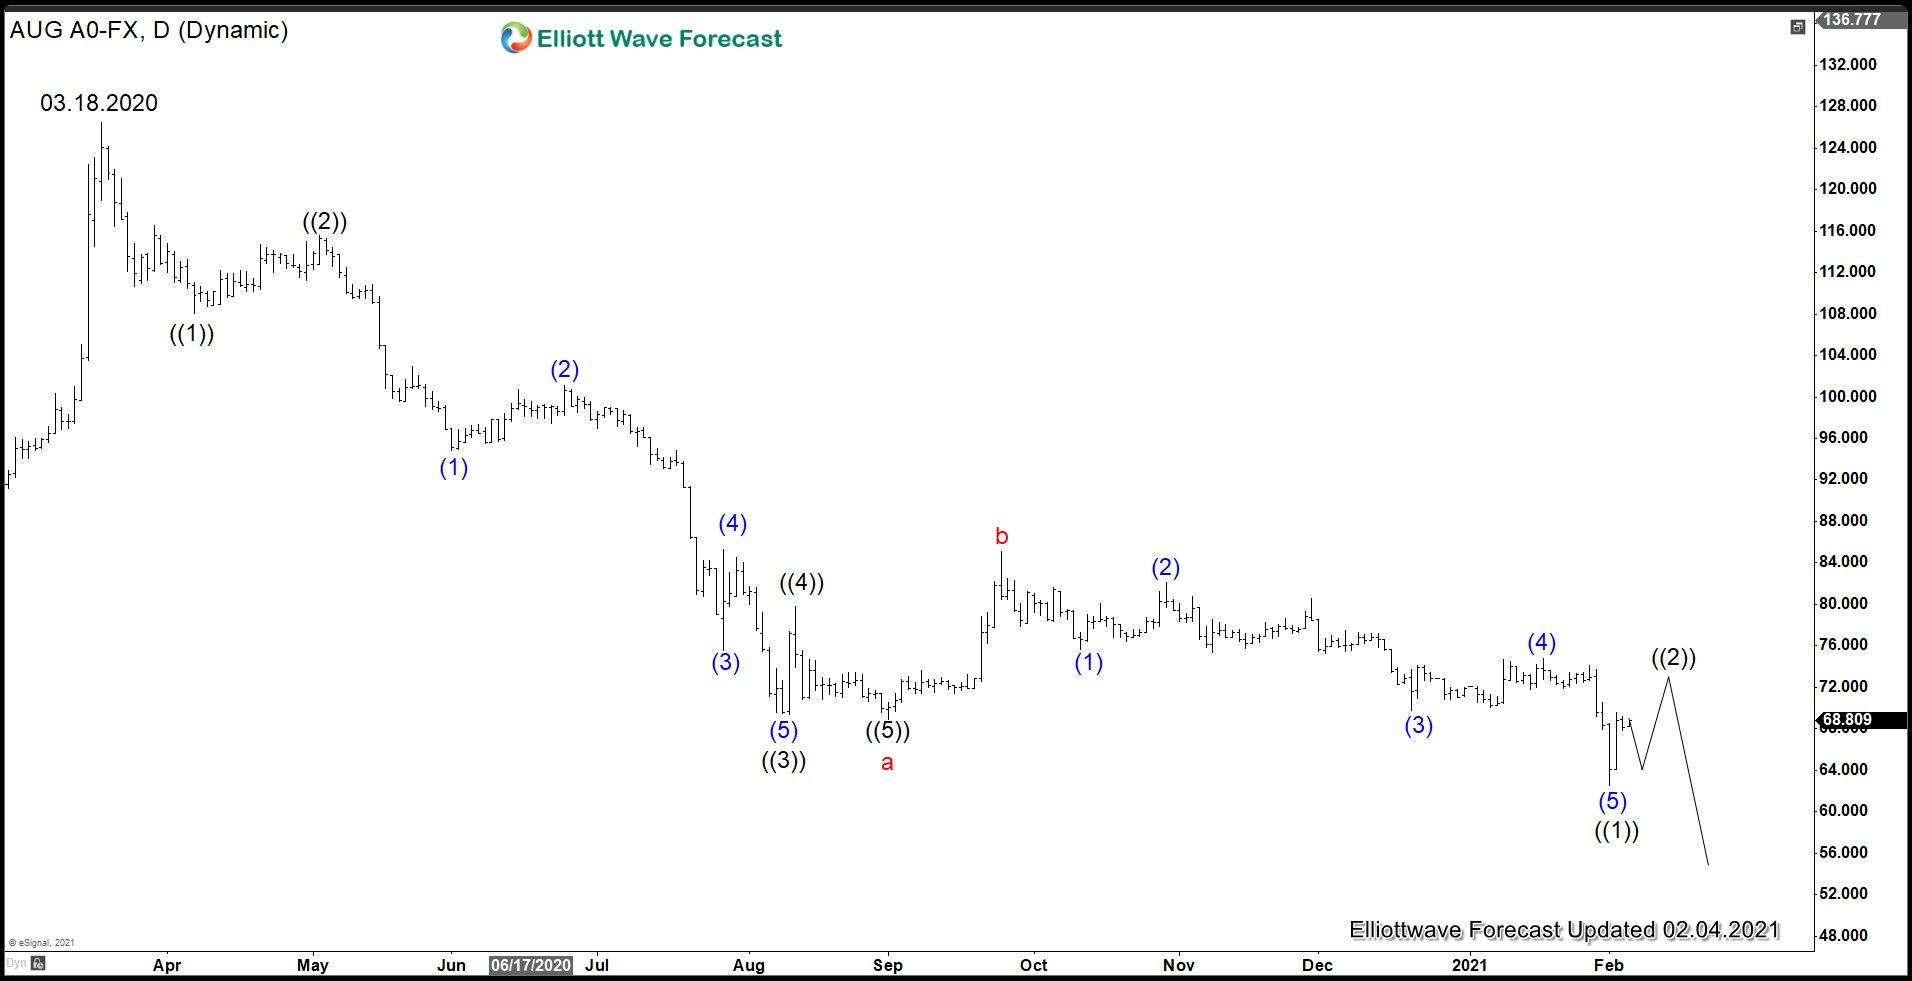
The chart above suggests the decline from 3.18.2020 high is unfolding as an impulsive 5 waves and ended wave a at 68.90 on September 2020. The ratio since then has been consolidating and ended wave b at 85.14. It has broken below wave a again this week suggesting the next leg lower has started. This ratio is inversely correlated with the underlying physical gold and silver. In other words, when the ratio breaks lower, the price of Gold and Silver will trend higher with Silver outperforming Gold.
Silver (XAGUSD) Elliott Wave Chart
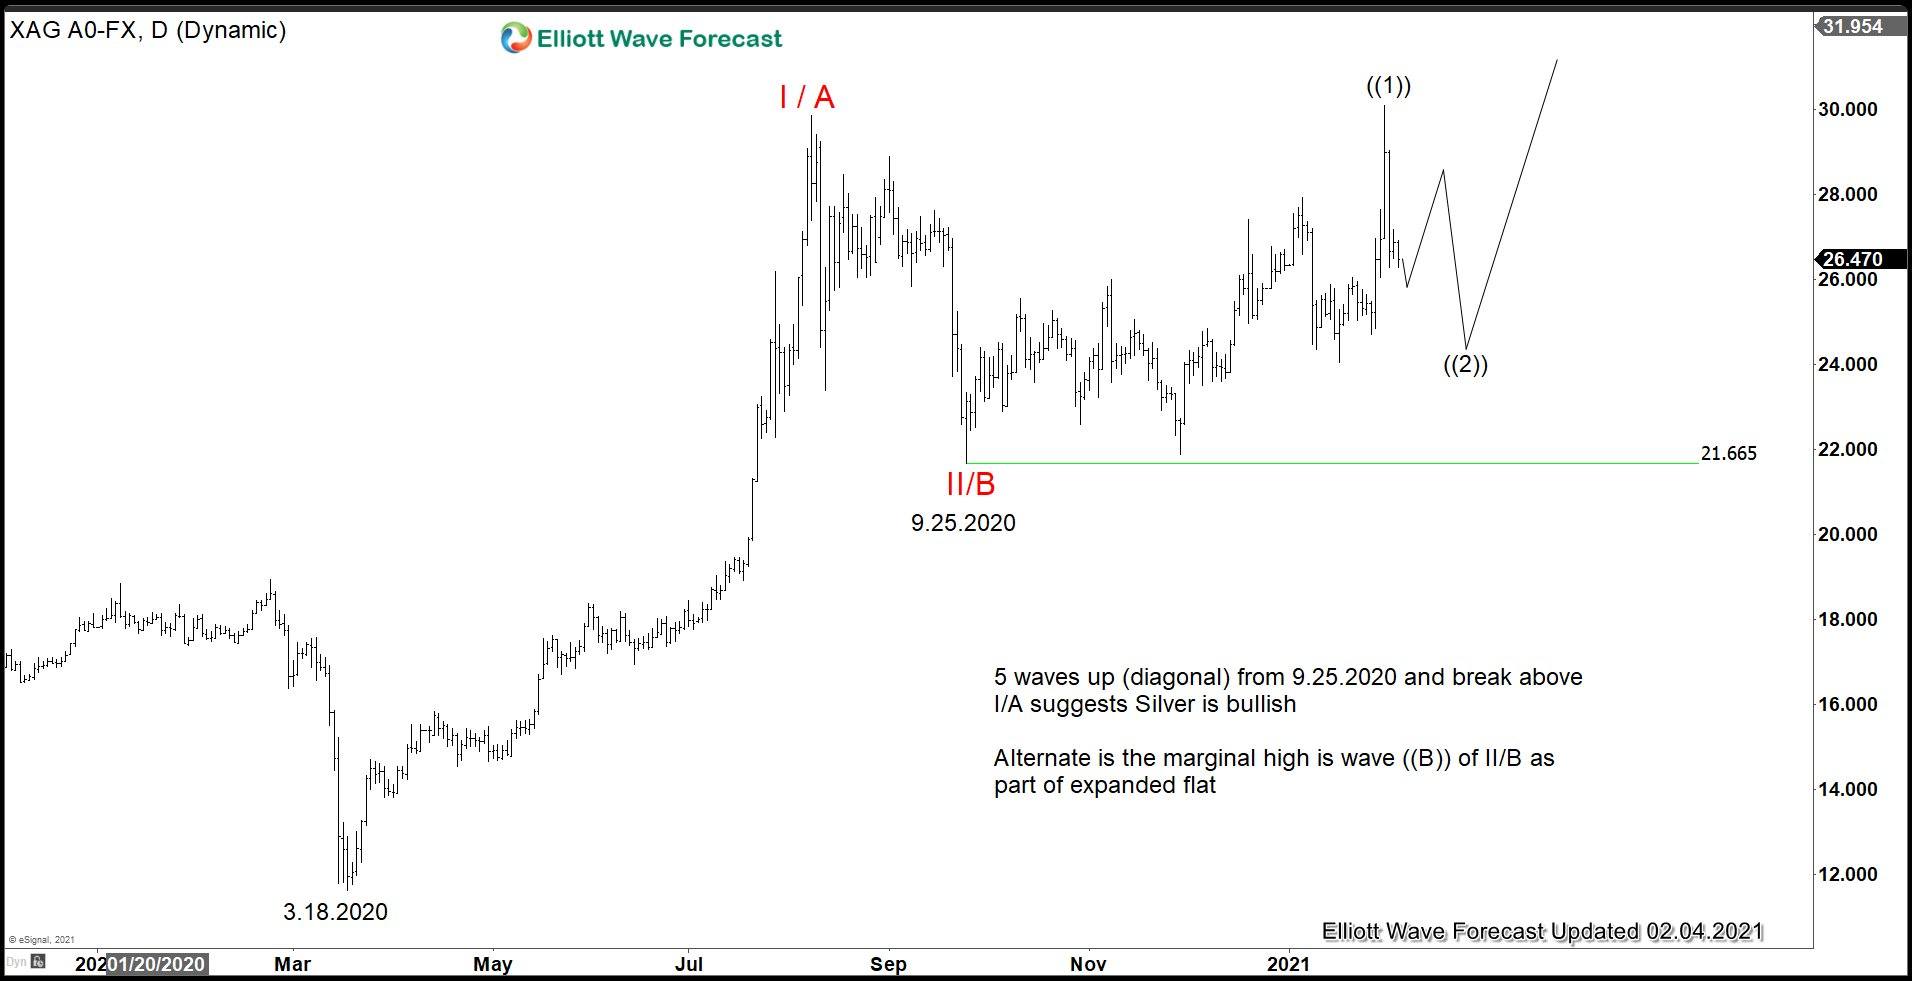
After bottoming on March 18, 2020 low during the Covid-19 selloff, Silver rallied impulsively from $11.64 to $29.86 in a matter of just 5 months. That rally ended wave I or A. It then corrected 27% in just a little over 1 month ended wave 2/B at $21.6. With this week's price action, Silver manages to take out wave I/A and creates a bullish sequence. Furthermore, the rally from wave 2/B low is in 5 waves (diagonal), suggesting further upside is likely while pullback stays above there. Alternatively, Silver can do an expanded flat in which 9.25.2020 low is wave ((A)) and the marginal high is wave ((B)), and now can see wave ((C)) of II/B lower which can potentially break below 21.66 before the metal rallies higher again. This view however is not our primary view as we don't forecast a flat against a clear trend.
Author

Elliott Wave Forecast Team
ElliottWave-Forecast.com


