Silver enters strategic pricing phase as industrial demand tightens supply

Key takeaways
Silver continues to attract industrial participation as supply flexibility remains constrained
Electrification demand and inventory sensitivity support structural involvement across the market
NFP positioning concentrates around the upper range as silver maintains release-phase momentum
Silver evolves into a strategic industrial asset
Silver is increasingly trading through industrial participation, supply sensitivity and electrification demand rather than through traditional precious metals behavior alone. The market is evolving toward a framework where industrial continuity and access to refined material shape engagement across the structure.
This transition becomes more visible during periods of macro positioning such as the current pre NFP environment. Payroll expectations still matter because labor data influences yields, Dollar behavior and broader market exposure. At the same time, silver now absorbs these macro signals through a deeper industrial layer linked to manufacturing, solar expansion, electronics demand and inventory availability.
The result is a market where macro catalysts interact with structural industrial dynamics rather than operating in isolation.
Industrial participation remains the dominant driver
Industrial demand continues to provide the strongest foundation for silver pricing. Solar installations, electrification infrastructure, electronics manufacturing and advanced industrial applications maintain steady involvement across the physical market.
The solar segment remains particularly important. Photovoltaic demand continues to absorb large volumes of refined silver, tightening the relationship between industrial expansion and physical availability. Industrial buyers increasingly operate within a system where access conditions matter alongside price itself.
Copper and broader industrial metals reinforce this environment. The alignment between silver and copper reflects continuing participation across manufacturing and electrification channels. Industrial metals remain supported despite uneven macro conditions, confirming that production systems continue to absorb material at elevated levels.
This participation structure reduces the market’s sensitivity to short term volatility. Industrial flows maintain continuity across pricing phases because supply chains require operational consistency rather than opportunistic timing.
Inventory sensitivity reinforces structural participation
Inventories remain one of the most important variables inside the silver system. Available buffers across exchanges continue to operate under tighter conditions compared with historical norms, increasing sensitivity to changes in industrial demand and investment positioning.
This creates a framework where inventory drawdowns influence market behavior progressively rather than through abrupt shortage dynamics. Physical availability remains sufficient for current operational needs, though elasticity across the system continues to narrow as industrial demand expands.
Refining capacity and material distribution also contribute to this tightening process. Access to refined silver increasingly depends on throughput efficiency, timing and allocation conditions across industrial networks.
The market therefore integrates pricing through positioning and access simultaneously. This explains why silver continues to maintain engagement near the upper range despite repeated rotational phases across the broader macro environment.
Macro positioning still shapes directional energy
The payroll release remains the dominant macro catalyst of the session because labor data directly influences real yields, policy expectations and Dollar positioning.
Markets expect payroll growth near 65K together with stable unemployment and moderate wage growth. These expectations create a macro environment where the market continues to evaluate the balance between labor resilience and financial conditions.
Silver reacts to this process through positioning behavior. Treasury yields and the Dollar remain important variables because they shape the financial layer of metals exposure. Stable yields and controlled Dollar conditions allow silver to preserve continuity near the upper positioning zone.
The current market environment reflects calibration rather than disorderly repricing. Exposure continues to distribute progressively across the structure while participants prepare for payroll volatility.
Cross asset participation confirms industrial alignment
Cross asset behavior supports the industrial interpretation of silver pricing. Copper remains constructive, industrial metals continue to stabilize and solar involvement remains active across the broader electrification chain.
This alignment matters because silver increasingly trades as part of a strategic industrial ecosystem rather than as a standalone monetary asset. Positioning across metals reflects continuity in manufacturing systems, energy transition infrastructure and industrial investment.
The relationship between silver and industrial flows also strengthens the role of inventories within price formation. As industrial systems continue absorbing material, sensitivity to availability becomes progressively more important.
This process contributes to the release-phase behavior currently visible across the market.
Technical structure: Silver develops within a release-phase positioning regime
Silver continues to operate inside a high involvement rotational structure centered around the 79.20 pivot, which acts as the main organizational zone of the current regime.
Price repeatedly rotates around this area while maintaining continuity near the upper half of the broader structure. This repeated engagement confirms active flow absorption and reinforces the role of the pivot as the point where industrial flows, macro positioning and directional energy converge.
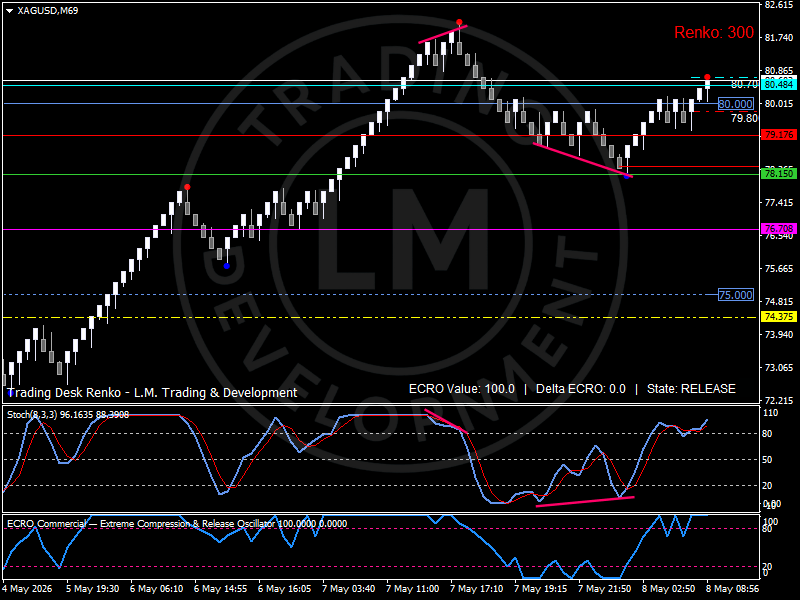
The upper structure develops toward 80.48 and 80.84, where previous upward extensions encountered reduced continuity and generated rotational pullbacks. Acceptance above this zone would expose the broader 81.70–82.00 expansion layer.
Support develops near 78.15 as the first reaction zone, followed by the deeper structural layer near 76.70. These areas continue absorbing corrective pressure while preserving continuity across the broader framework.
The Renko sequence shows alternating phases of extension and controlled pause while maintaining upward engagement across the structure. Higher reaction lows remain visible and industrial involvement continues rebuilding progressively across the upper range.
The ECRO indicator remains at 100 with a neutral delta, reflecting a release state where directional energy remains fully active inside the structure. Momentum conditions continue to support positioning while preserving rotational stability ahead of payrolls.
Bird’s eye view: Silver market map
Market Regime: Release-phase industrial positioning structure
Regime Pivot: 79.20.
Upper Positioning Zone: 80.48 → 80.84.
Expansion Layer: 81.70 → 82.00.
Support Structure: 78.15 → 76.70.
Pressure Zone: Below 76.70 exposes deeper structural recalibration.
Systemic Indicators to Watch: Industrial demand, solar participation, inventory behavior, payroll expectations and Dollar positioning
Outlook
Silver continues to evolve within a strategic industrial framework where industrial involvement, inventory sensitivity and macro positioning remain interconnected.
The market maintains continuity near the upper range as industrial demand continues to support structural engagement across the system. Solar expansion, industrial metals alignment and constrained supply flexibility reinforce positioning even as markets prepare for payroll volatility.
The next directional phase depends on how labor data influences yields, Dollar positioning and broader market exposure. At the same time, industrial demand and inventory conditions continue to shape the deeper structural layer of the market.
As long as industrial continuity remains active and supply flexibility stays constrained, silver can maintain engagement across the upper positioning zone while directional energy continues rebuilding through the current release phase.
Author

Luca Mattei
LM Trading & Development
Luca Mattei is a market analyst focusing on FX, metals, and macroeconomic trends. He develops trading tools for retail and professional traders, coding indicators and EAs for MT4/MT5 and strategies in Pine Script for TradingView.