Silver Elliott Wave view: $61.02 level holds key to potential bearish extension [Video]
![Silver Elliott Wave view: $61.02 level holds key to potential bearish extension [Video]](https://editorial.fxsstatic.com/images/i/Silver3.png)
Silver (XAGUSD) is approaching a decisive test as price nears the March 23, 2026 low at $61.02. A break beneath this level could trigger a deeper decline, potentially extending toward the 100% measured move from the January 29, 2026 all‑time high. If the sequence unfolds without truncation, the projected target may reach as low as $38.70.
The decline from the March 2, 2026 high is developing as a double three corrective pattern. Wave ((W)) concluded at $61.02, while wave ((X)) terminated at $89.37. The subsequent wave ((Y)) is unfolding as another double three of lesser degree. From the peak of wave ((X)), wave A ended at $73.81, followed by a rally in wave B that reached $77.51. The market is now extending lower in wave C of (W), which is forming as a five‑wave impulse.
Spot Silver 60-minute Elliott Wave chart
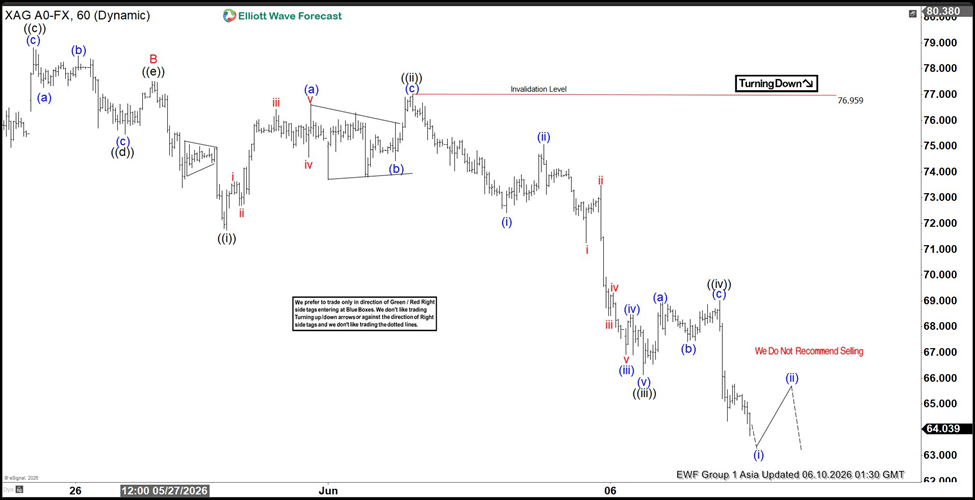
On the hourly chart, wave ((i)) of C ended at $71.75, while wave ((ii)) retraced higher to $77. Wave ((iii)) then drove price down to $66.13, and wave ((iv)) is proposed complete at $69.02. Near term, while price remains below $76.96, rallies are expected to fail in either three or seven swings. This structure suggests that silver retains considerable downside risk, with corrective rallies offering limited relief before the metal resumes lower.
XAG/USD Elliott Wave video
Author

Elliott Wave Forecast Team
ElliottWave-Forecast.com


