Silver almost nails our Fibonacci target; Copper bears have another destination in sight


Well, Tuesday has given us a couple of particularly interesting developments.
Yesterday, several markets were attempting to recover from important technical support areas, but the sellers apparently weren't finished.
Silver has now come within striking distance of a weekly Fibonacci support level we highlighted just one day ago and copper? After completing an ABC correction we'd been tracking in earlier Labs, it has fallen through that former target area again, raising an uncomfortable question for buyers.
What if the earlier correction was only part of something bigger?
That's not the only interesting development.
The monthly chart has revealed another technical reason why copper's next major downside target area could become important.
Meanwhile, silver is giving us a very different kind of puzzle.
The bears have the stronger technical structure, but they're approaching support that buyers may be reluctant to surrender.
So, which side has the advantage? And more importantly, what would it take to change that advantage?
Let's take a closer look.
Chart note: Price-gap boundaries reflect our current continuous futures charts and may differ from historical values quoted in earlier Labs.
Silver (SI.F) - The Bears Have the Advantage. But There's a Catch.
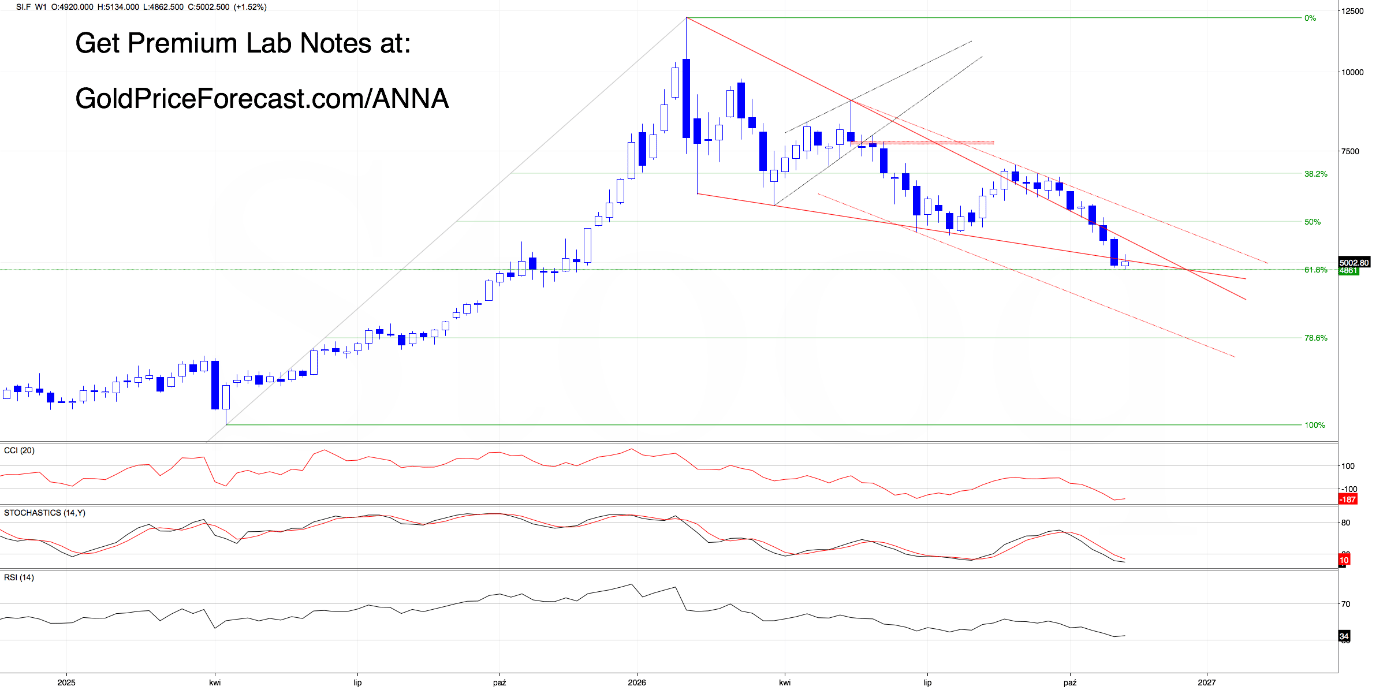
In yesterday's Premium Lab Note, we wrote the following:
“(…) And what if this week's optimism fades?
The weekly 61.8% Fibonacci retracement near 4861 offers another potential support reference below the recent lows. (…)”.
From today’s point of view, we see silver has just come remarkably close, hitting today’s low at 4862.50 and… once again, the market has given us an interesting reaction around a previously identified technical level.
But let's not get carried away.
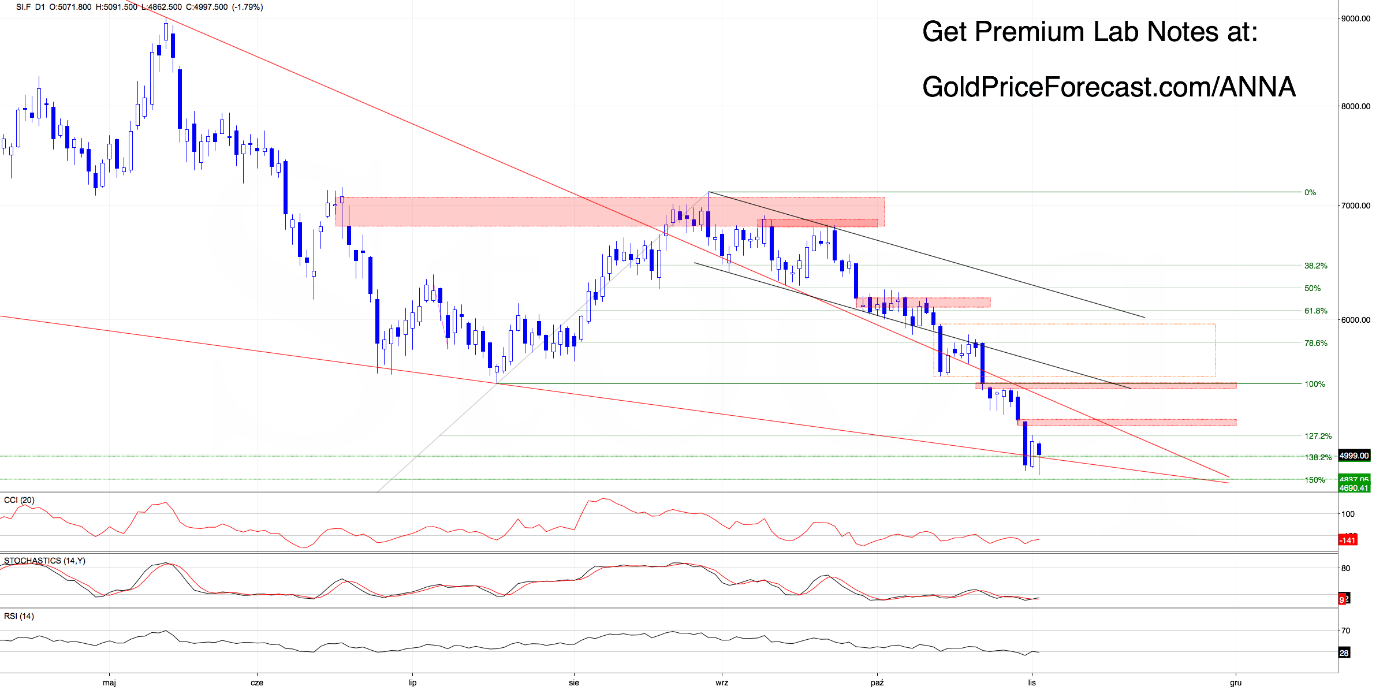
Monday's recovery invalidated the red triangle breakdown on the daily chart, after buyers managed to reclaim its lower boundary. That was encouraging, however, the weekly breakdown remained confirmed, and Tuesday's decline has shown why that distinction matters.
Sellers pushed silver below Friday's low, reaching the Fibonacci support before buyers staged another counterattack. The price subsequently recovered toward 5000 and moved back toward the triangle boundary.
So, does this mean the bulls are gaining strength?
Not necessarily.
The buyers are defending an important area, but they haven't demonstrated the ability to recover meaningful overhead resistance.
Meanwhile, the bears face a problem of their own.
The weekly Fibonacci support near 4861 sits close to an area with historical significance dating back to April 2011, which we discussed yesterday when examining the monthly chart.
In other words, sellers have the structural advantage, but they don't have an entirely clear runway lower.
A confirmed loss of the current support combination would revive the deeper downside projections around 4837.05, followed conditionally by 4690.41.
For buyers, the first challenge remains defending the triangle's lower boundary, with a weekly close above that dynamic line needed to invalidate the confirmed weekly breakdown. Beyond that, the bearish gap at 5225-5238 represents the next recovery obstacle. Nevertheless, the much more important combination at 5469.50-5500.70, including the older bearish gap, July low, and triangle resistance, still stands considerably higher.
Until buyers overcome those barriers, we'd rather observe than mistake another defensive rebound for a genuine reversal.
Daily Takeaways: Silver nearly reached the weekly Fibonacci support near 4861, reinforcing the importance of the current support area. Watch the triangle's lower boundary for daily and weekly confirmation, followed by 5225-5238 and 5469.50-5500.70 for resistance. Losing support could expose 4837.05 and eventually 4690.41.
Bottom Line: the bears remain structurally stronger, but nearby support makes further downside progress less straightforward. Neither side has yet delivered a convincing reason to abandon caution.
Copper (HG.F) - The ABC Correction Was Completed. Are the Bears Telling Us There's More?
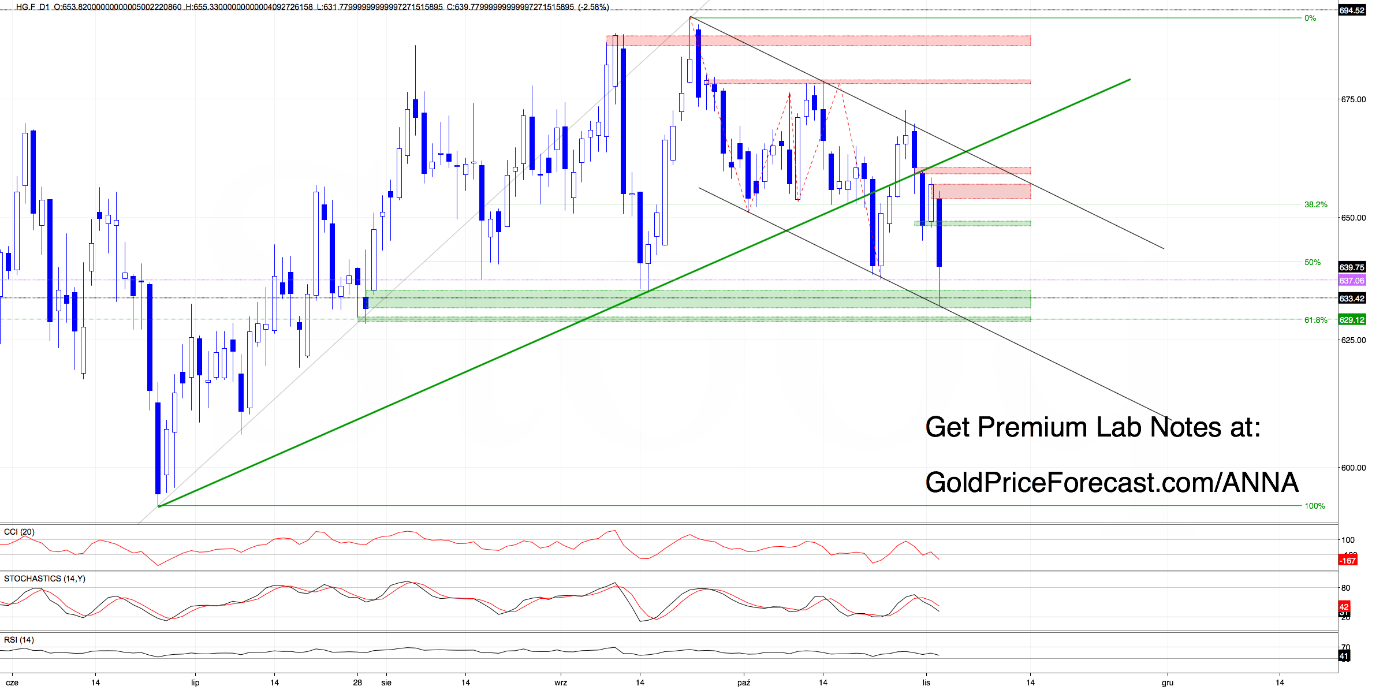
Copper finally delivered the kind of bearish follow-through that had been on our radar.
Yesterday’s bullish opening gap (648.20-650.68) and white daily candle looked encouraging at first glance, but the bulls still ended the session below the key resistance area - including the lower border of the green wedge and the nearby bearish gap.
That was a clear warning sign and today, the bears took advantage of that weakness almost immediately.
The session started with a fresh bearish gap (653.82-656.75), and the selling pressure pushed copper not only below 637, but also down to an important support combination based on the bullish gap from July 30 (631.15-634.95) and the lower border of the black declining channel.
This area finally encouraged the bulls to fight back, triggering an intraday rebound.
Even so, the bigger picture has not improved much.
Why?
Because copper remains well below today’s opening gap and below the resistance zone created by the lower border of the green wedge and the Oct. 30 bearish gap (659.10-660.25). In other words, unless the bulls reclaim that resistance cluster, today’s rebound may end up being just a pause within a broader downswing.
And that broader downswing is exactly what we had in mind earlier, when we noted in our Free Lab Note posted on Oct. 23 that the move to 637 might be more than just a completed ABC decline.
With 637 now broken, the next downside target area near 629-625 remains very much in play. Importantly, this zone is reinforced by the upper border of the pink rising channel on the monthly chart below, which comes in near 625 this month and makes the area even more significant.
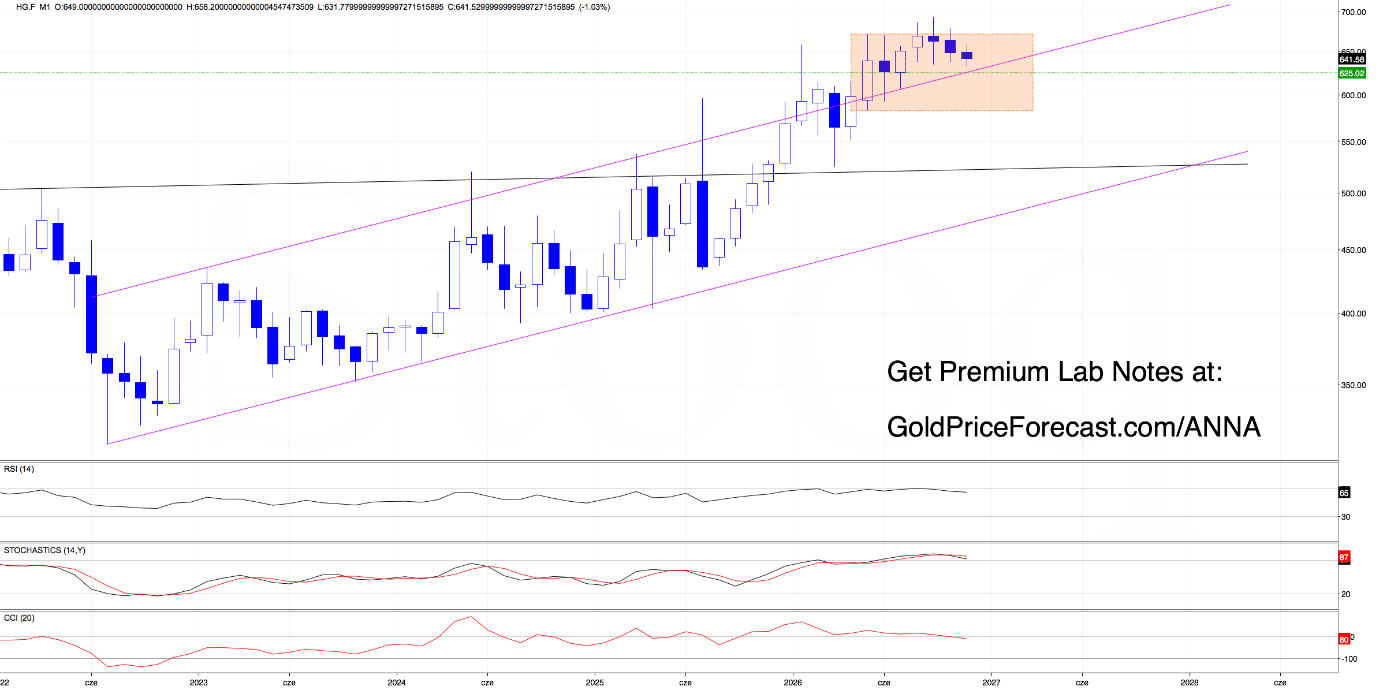
So, for now, the bears still have the upper hand. To weaken the bearish scenario, the bulls would need to invalidate today’s breakdown and return above the key resistance zone based on the lower border of the green wedge and the bearish gap.
Daily Takeaways: Tuesday's decline carried copper below 637 and into the support combination around 631.15-634.95, reinforced by the lower boundary of the black declining channel. Yesterday’s bullish gap at 648.20-650.68 and bearish gaps at 653.82-656.75 and 659.10-660.25 remain important reference points. Continued weakness could bring 625-629 into focus, now reinforced by the monthly pink channel boundary near 625.
Bottom Line: Copper's sharp decline has strengthened the case for a larger bearish correction. The next downside objective has compelling technical support across several timeframes, while buyers still face significant resistance before they can challenge the broader bearish picture.
What about Gold, the Dollar, Platinum, and Palladium?
While silver and copper are giving us plenty to think about, the other four markets are facing important decisions of their own.
Gold is retesting yesterday's recovery from a long-term support combination. Buyers managed to reclaim important technical ground on Monday, but can they defend that progress against Tuesday's renewed selling pressure?
The U.S. dollar continues to defend the support that keeps its potential double-bottom scenario alive. Unfortunately for the bulls, nearby bearish gaps remain stubborn obstacles.
Platinum has delivered another local low after opening Tuesday with a fresh bearish gap. The broader bearish structure remains intact, but the next important support area is drawing closer.
And palladium has slipped beneath a support line that buyers defended just yesterday. With a deeper monthly downside objective now in focus, the next technical barriers could become particularly important.
In today's complete Anna's Trading Lab Premium, we examine these four additional markets, follow the latest changes in their technical structures, and identify the price levels and closing confirmations that could determine their next meaningful moves.
Final thought - The market still has something to prove
One of the most interesting things about technical analysis is watching what happens after an anticipated level is reached.
Sometimes the market turns, sometimes it pauses and sometimes a completed objective becomes the starting point for an even larger move. That's exactly why we never treat a target as a promise.
The destination matters, but the reaction when prices get there can tell us even more.
Right now, several markets are giving us plenty of reasons to keep watching.
Author