|

Silver: A break below 1920 is a sell signal

Gold Spot we wrote: likely to be forming yet another bear flag, meaning eventually we will break lower, but it is impossible to now the timing.

fxsoriginal

Well it happened on Friday!! Selling at resistance at 1675/80 worked last week & finally we broke below 1650 for the next sell signal, initially we targeting 1640/35 - a low for the day exactly here in fact. Outlook remains negative.

Silver we wrote: key support at 1950/30. A break below 1920 is a sell signal.

Silver also broke lower to the next target of 1880/70, with a low for the day exactly here. Outlook remains negative.

WTI Crude November made a breakout of the September low at 8125/8090 the downside as predicted for an obvious sell signal targeting 7950/20 & 7800. A low for the day exactly here in fact

Remember when support is broken it usually acts as resistance & vice-versa.

Daily analysis

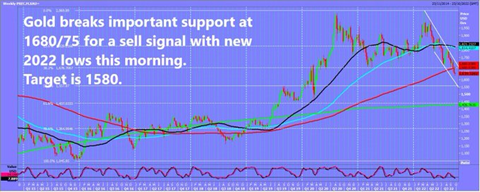
Gold broke lower & kindly retested the break point at 1650/55 to allow us to get in to shorts after the sell signal was triggered. We hit the next target of 1640/35, as we look for 1610/00. I am looking for a break below 1590 to targets 1560/55.

Gains are likely to be limited with key resistance now at 1650/55. A break higher however can target 1680/90. Shorts need stops above 1700.

Silver broke key support at 1950/30 for a sell signal targeting 1880/70, perhaps as far as 1850/40 on Monday. If we continue lower look for 1810/00.

First resistance at 1930/50. Shorts need stops above 1960.

WTI Crude November shorts on the break below 8090 worked perfectly targeting 7950/20 & 7800. From a 1 month trend line at 7800 down to the 100 week moving average at 7750 is first support today. A break lower is another sell signal targeting the 500 day moving average at 7630/00. Failure to hold above here is an important longer term sell signal.

Author

Jason Sen

Jason Sen

DayTradeIdeas.co.uk

More from Jason Sen
Share:

Editor's Picks

EUR/USD consolidates around 1.0900, bullish bias remains ahead of key US data

The EUR/USD pair is seen consolidating its strong gains registered over the past two days and oscillating in a narrow band during the Asian session on Tuesday. Spot prices currently trade around the 1.1900 mark, just below an over one-week high touched the previous day.

GBP/USD tilts bullish as markets barrel toward mid-week NFP print

GBP/USD is holding a broader bullish structure on the daily chart, with price trading well above the 50 Exponential Moving Average at 1.3507 and the 200 EMA at 1.3310, confirming the intermediate uptrend that has been in place since the November 2025 low near 1.2300. 

Gold: Will US Retail Sales data propel it above $5,100?

Gold hovers below weekly highs of $5,087 early Tuesday, await US Retail Sales data. The US Dollar enters a downside consolidation phase amid persistent Japanese Yen strength and worsening labor market. Gold settled Monday above $5,000, now looks to take out $5,100 amid bullish daily RSI.

Top Crypto Gainers: World Liberty Financial, MemeCore and Quant gain momentum

World Liberty Financial, MemeCore, and Quant are leading gains over the last 24 hours as the broader cryptocurrency market stabilizes after last week’s correction. Still, the technical outlook for altcoins remains mixed due to prevailing downside pressure and vulnerable market sentiment. 

The market is buying everything again but is it dancing on a borrowed floor

The market has a short memory and a fast trigger finger. Last week’s liquidation barely cooled before risk came roaring back, pushing the S&P toward record territory and reinstalling Big Tech as the engine of choice. This is not discovery. It is re exposure.

Ripple exposed to volatility amid low retail interest, modest fund inflows

Ripple (XRP) is extending its intraday decline to around $1.40 at the time of writing on Monday amid growing pressure from the retail market and risk-off sentiment that continues to keep investors on the sidelines.