Signs of Reversal?

NZDUSD,
NZDUSD has retest today once again the month’s high and the significant psychological level at 0.7000. The New Zealand dollar along with Canadian dollar have been the outperformers of the market for the last 2 days, showing respective gains of 1.9% and 1.5% against the U.S. dollar, since there latest bottom levels. The Kiwi faced some losses in the morning on the release of ANZ Business Confidence, however the strong Chinese data, helped NZD to reinforce the positive momentum seen after the remarks from RBNZ Governor Orr, who said that credit growth in New Zealand hadn’t slowed sufficiently. The Chinese May manufacturing PMI beat expectations, at 8-mth high of 51.9, while Services PMI rose to 54.9 from Apr’s 54.8.
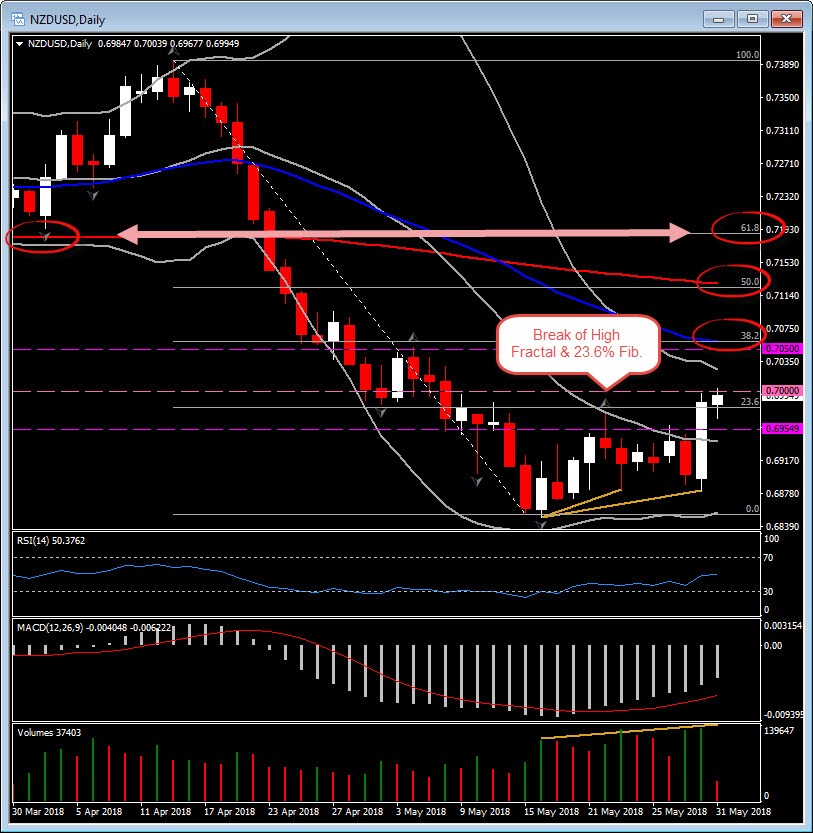
Therefore the data along with RBNZ have help Kiwi to close yesterday above the 20-DAY MA and the latest up Daily fractal, while today it manage to be held above the 23.6% Fibonacci retracement since the fall seen from 0.7394 peak down to 0.6850. It is currently consolidated in the upper 0.69s area, after hit 0.7000 for 3 consecutive hourly sessions.
The NZDUSD has triggered our attention initially due to the performance of the Volume indicator along with Price action. The volume has been seen increasing on a price decline on May 23 and May 16, while the price moved higher afterwards, followed by a move back lower. The price on the move back lower on May 30, manage to stay higher than the previous low (May 25) , while volume diminished on the second decline. Therefore, this technical analysis of Volume along with price action, could be interpreted as a bullish sign, in long term. That is the reason that the break of the 23.6% fibonacci level, triggered our attention for NZDUSD cross and a possible reversal to the upwards for the pair.
The technical picture meanwhile, has giving some support that the bearish momentum has run out of steam and hence bulls are back in play. The weekly chart provides some mixed pictures, with RSI and MACD at neutral zone. However the fact the the pair manage to rebound above the extremely strong support area seen since December 2016, along with the decreasing volume on price declines, provide bullish signs for the pair.
The Daily RSI rebounded from oversold territory and is flattening today on the neutral zone, while Daily MACD oscillator slipped above its trigger line in the negative area, something that suggest again that momentum is too weak to provide a sustained move lower. In longer time-frames, such as Daily and Weekly, the pair could confirm upside pressure, only on the closing above 0.7000 today. The next immediate resistance levels come at the confluence of 38.2% Fibonacci retracement level and 50-DAY EMA, at 0.7050, while the consecutive resistance levels are place at 50% and 61.8% Fibonacci retracement levels. The 50% Fib. coincides with 200-DAY EMA (0.7120) , and the 61.8% Fib. level at 0.7180 with the strong support area seen from February-March 2018.
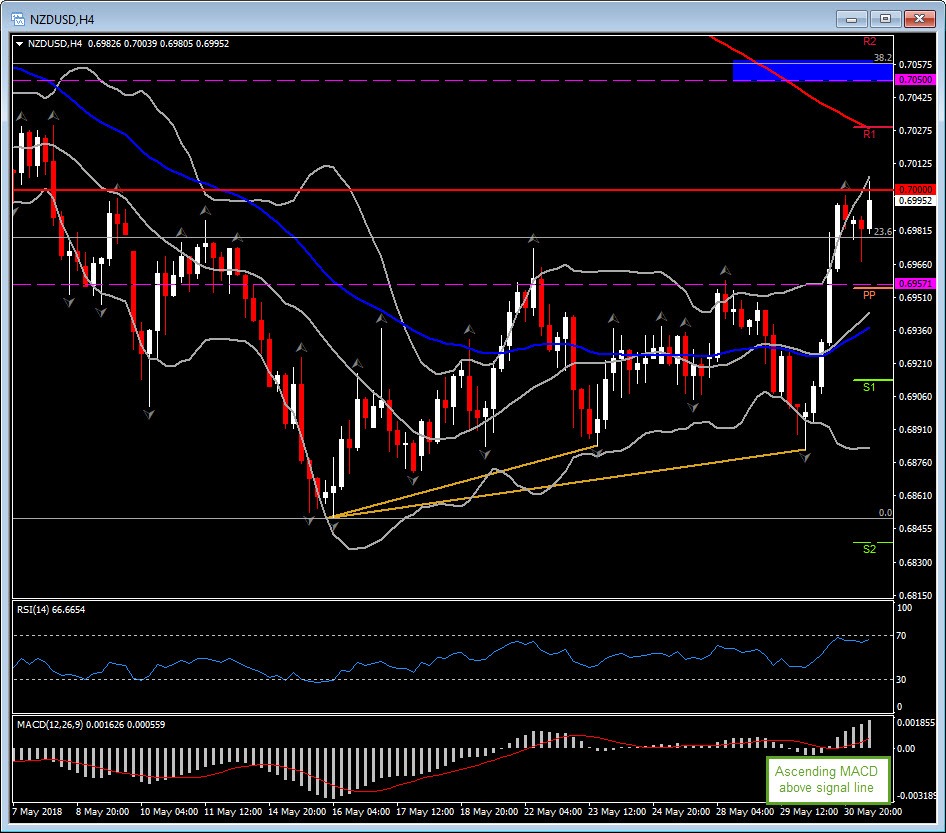
The 4-hour chart, presents the same positive picture, with RSI consolidating aroung 70 barrier, while MACD increases in the positive territory and above its signal line. Hence the technical pictures in the intra-day timeframe remains to the upside scenarion as well.
Should prices move lower, immediate support area could come at PP level and the latest swing high at 0.6950-0.6960 area . A drop below this area could take the price to the next support at 0.6910.If this breaks as well, then this could alert a retest of May’s low and the strong support for the last 2 year, at 0.6850.

Author

Having completed her five-year-long studies in the UK, Andria Pichidi has been awarded a BSc in Mathematics and Physics from the University of Bath and a MSc degree in Mathematics, while she holds a postgraduate diploma (PGdip) in


