September’s US employment report to rock the markets


September’s US employment report to shake the markets
We highlight today release of the US employment report for September. The NFP figure is expected to drop to 90k, compared to August’s 162k and the unemployment rate to remain unchanged at 4.1%. Yet should the actual data show the picture of a looser-than-expected US employment market for September, we may see the USD weakening while gold’s price and US equities may get some support as the market may have to ease its hawkish expectations for the Fed’s intentions. On the flip side, a possibly tighter-than-expected US employment market could provide some support for the USD and weigh on gold’s price.
US equities prepare for weekly losses
US equity indexes like Nasdaq, S&P 500 and Dow Jones prepare for weekly losses, as fundamental factors tend to weigh. The market’s hawkish Fed expectations, high US bond yields and AI technology tend to maintain worries for US equities. Yet the US employment report for September is due today, and a possibly looser-than-expected US employment market could come to the rescue.
Gold stabilises cautiously
Gold’s price remained relatively stable despite USD’s strengthening in the FX market. Overall, the movement of the two trading instruments tends to blur their usual negative correlation. We still view fundamentals behind gold’s direction as being adverse at the current stage, yet also highlight the release of the US employment report for September as the next big test for gold’s price.
Oil prices edge higher
Oil prices moved higher yesterday yet corrected in today’s Asian session, with the tensions in the Middle East remaining at the epicenter of the oil market’s attention. The international oil market seems to be refocusing on the possibility of increased oil outflows from the Strait of Hormuz weighing on oil prices, yet the possibility of renewed US-Iran tensions over the weekend could lift them.
Other highlights for today
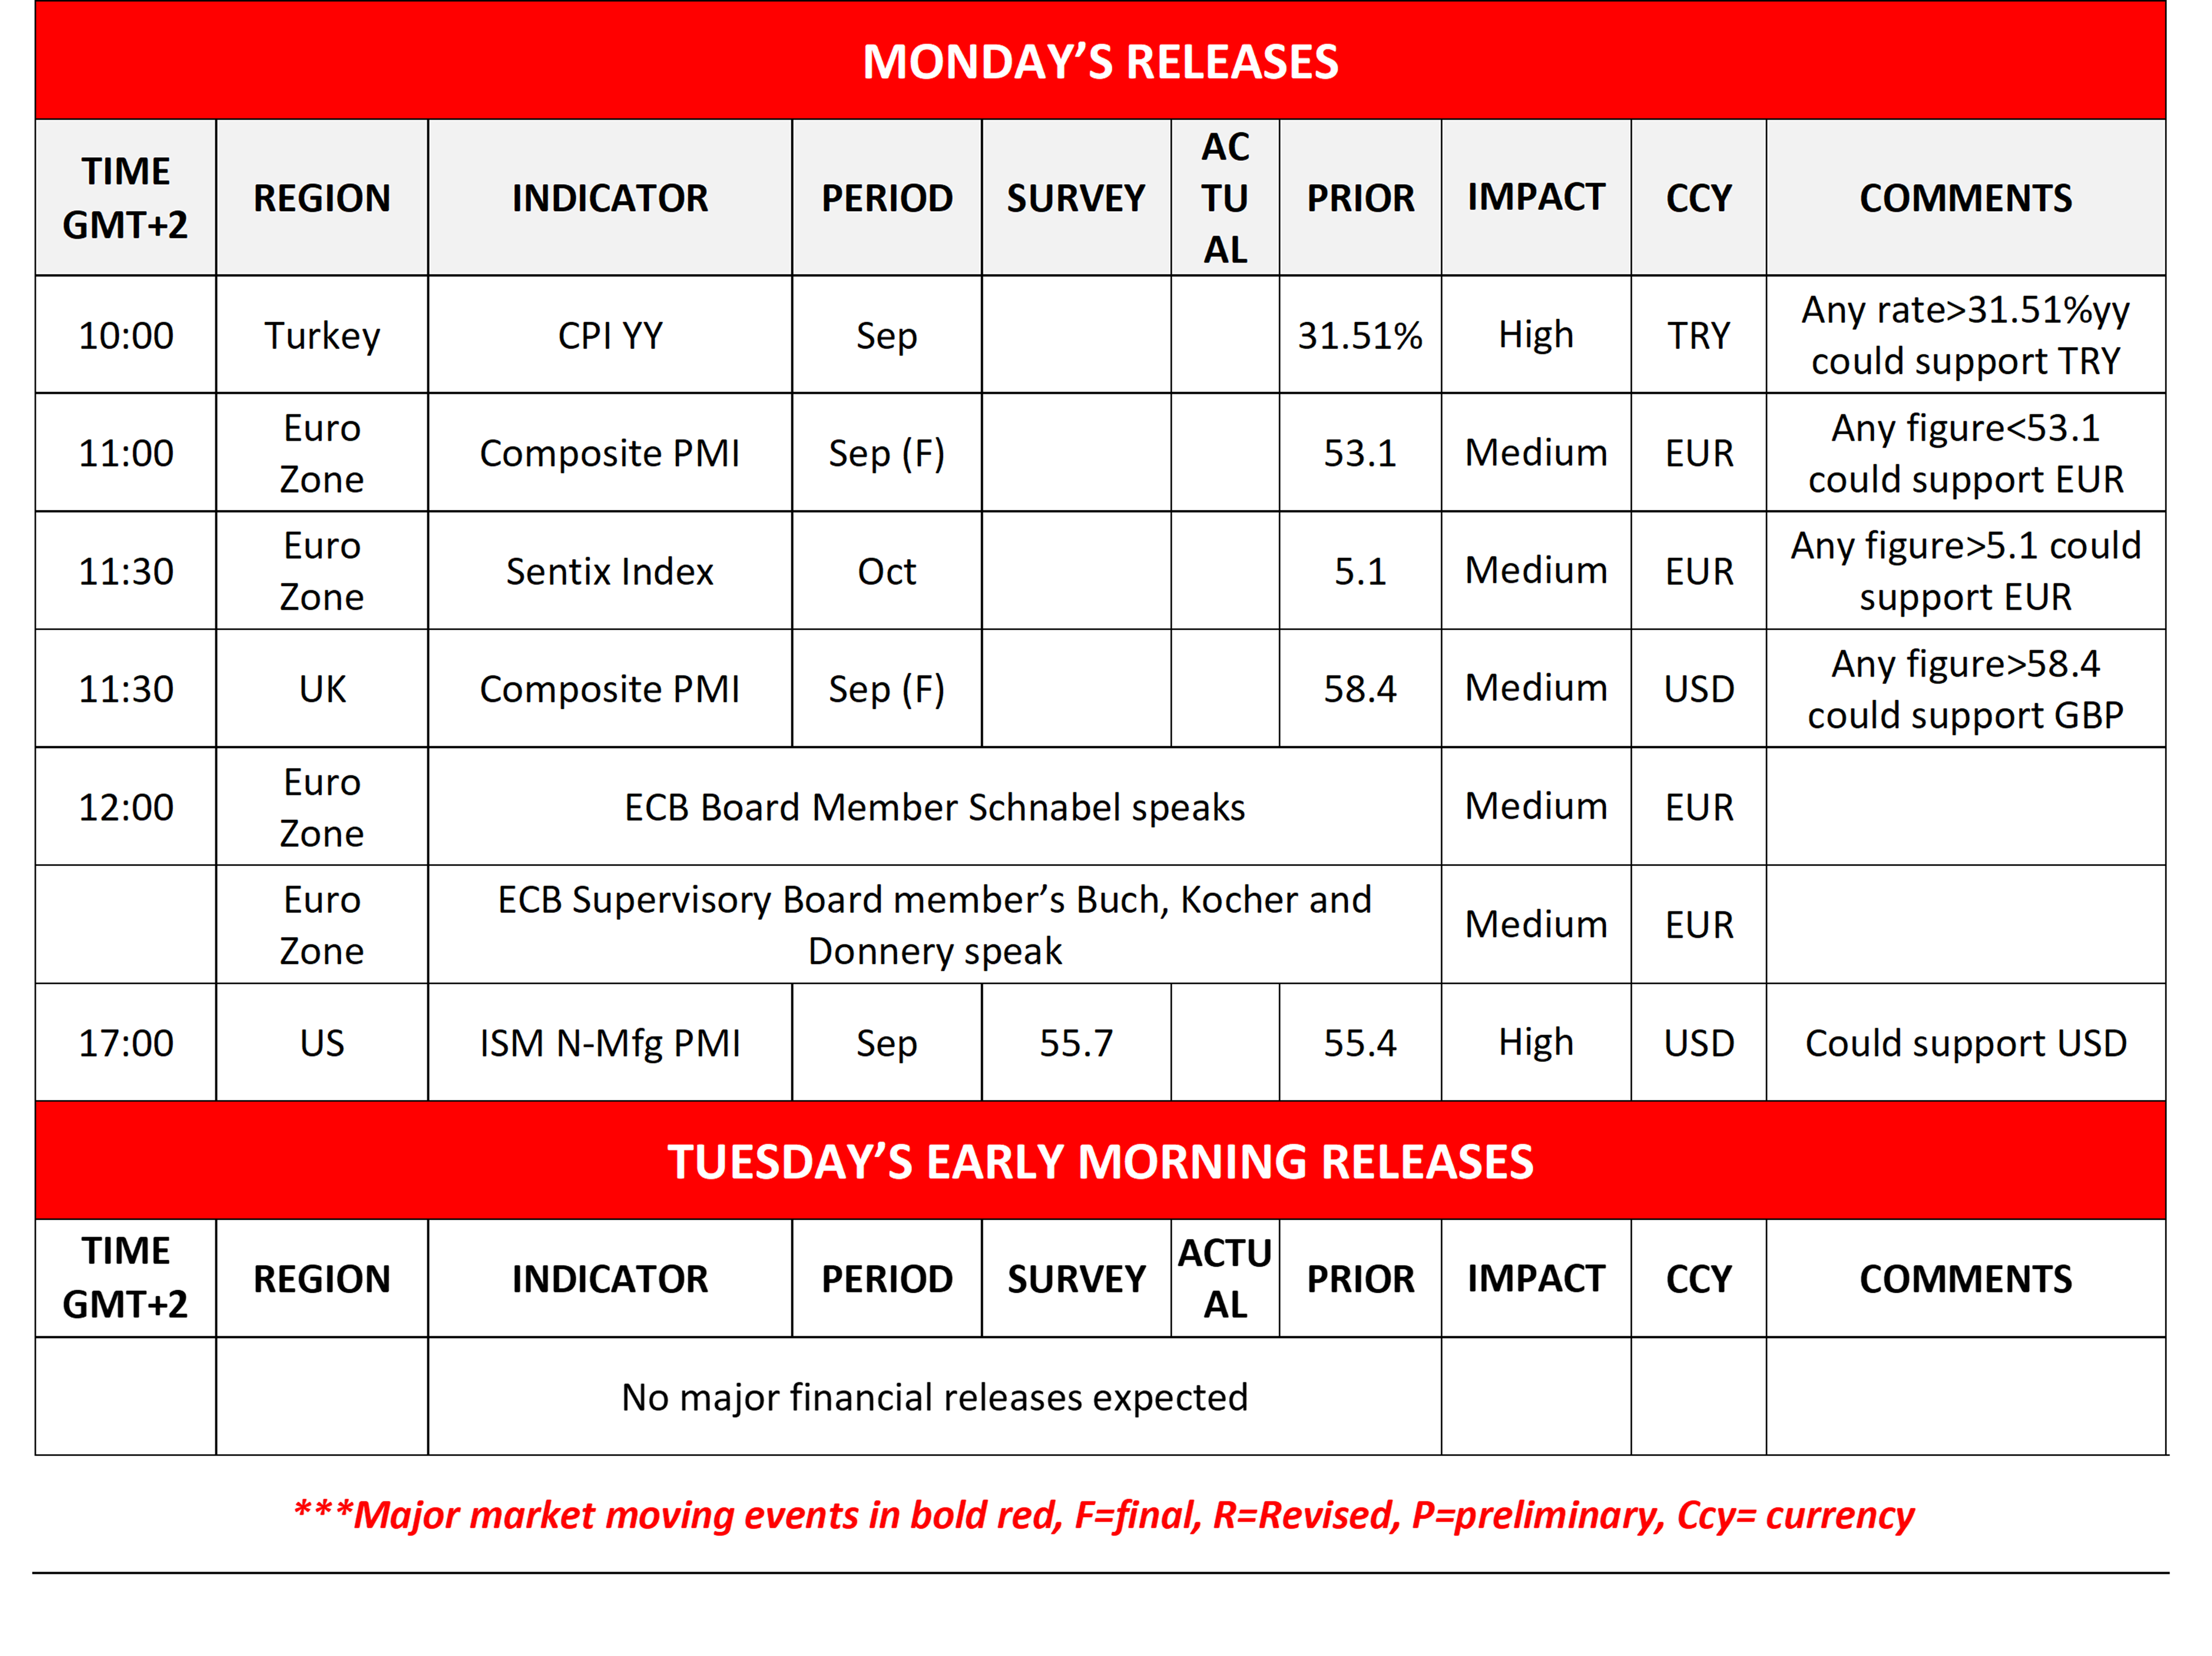
Today we get Euro Zone’s preliminary HICP rates for September, and the US factory orders for August. On a monetary level, ECB’s Cipollone, Vijcic, Rehn, Sleijpen and Buch as well as Dallas Fed President Logan are scheduled to speak. On Monday’s Asian session, we get Australia’s and Japan’s service and composite PMI figures for September.
Charts to keep an eye out
USD/JPY moved higher breaking the 157.50 (S1) resistance line, now turned to support. Yet the pair’s movement remains relatively unconvincing for the pair’s bullish tendencies given also that the RSI indicator remains near the reading of 50, implying a neutral market sentiment for USD/JPY. Should the bears lead USD/JPY we may see it breaching the 157.50 (S1) support line and start actively aiming if not nearing the 155.00 (S2) level. Should the bulls take over, USD/JPY may reach if not breach the 160.50 (R1) resistance line.
Gold’s price remained stable, well within the boundaries set by the 4275 (R1) resistance line and the 3960 (S1) support level. Yet the downward trendline remains active, highlighting the bearish potential for the precious metal’s price. Also the RSI indicator remains between the readings of 50 and 30, suggesting a bearish predisposition of the market for gold’s price. Should the bears take control over XAU/USD’s price we may see it breaking the 3960 (S1) clearly and start aiming for the 3600 (S2) support level. Should the bulls take over, Gold’s price, may break the initially the prementioned downward trendline, signalling an interruption of the downward motion of the precious metal’s price and continue to break also the 4275 (R1) resistance line and start aiming for the 4550 (R2) resistance level.
USD/JPY daily chart
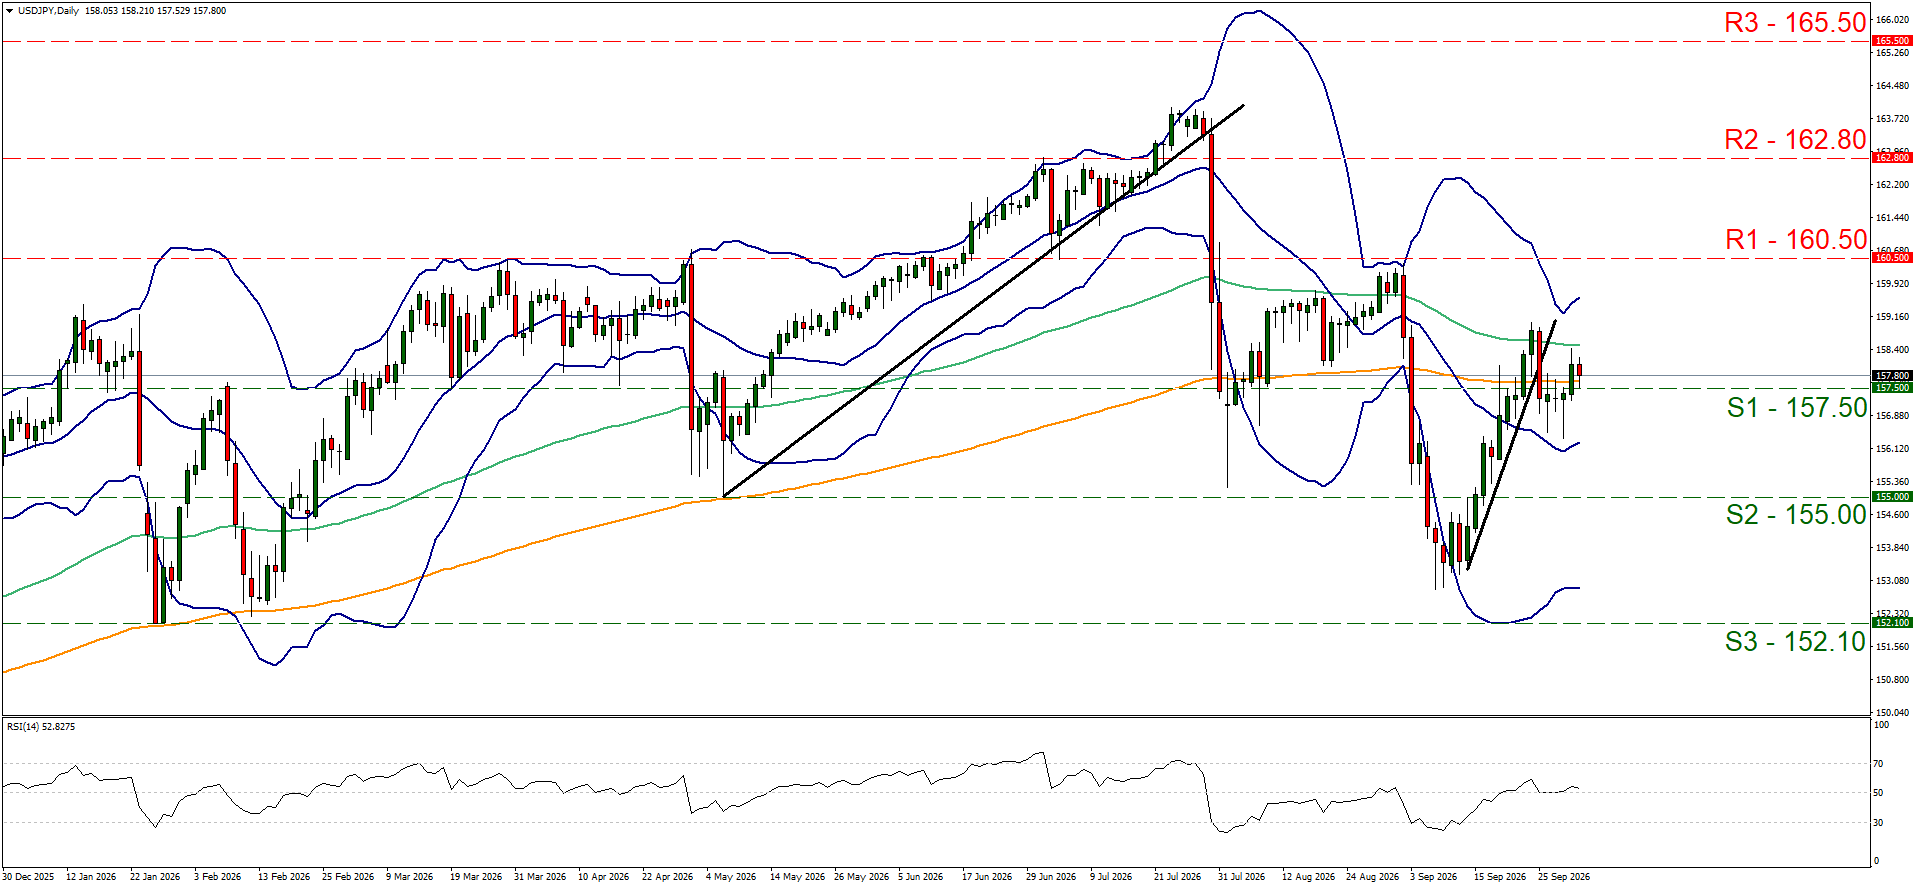
- Support: 157.50 (S1), 155.00 (S2), 152.10 (S3).
- Resistance: 160.50 (R1), 162.80 (R2), 165.50 (R3).
XAU/USD daily chart
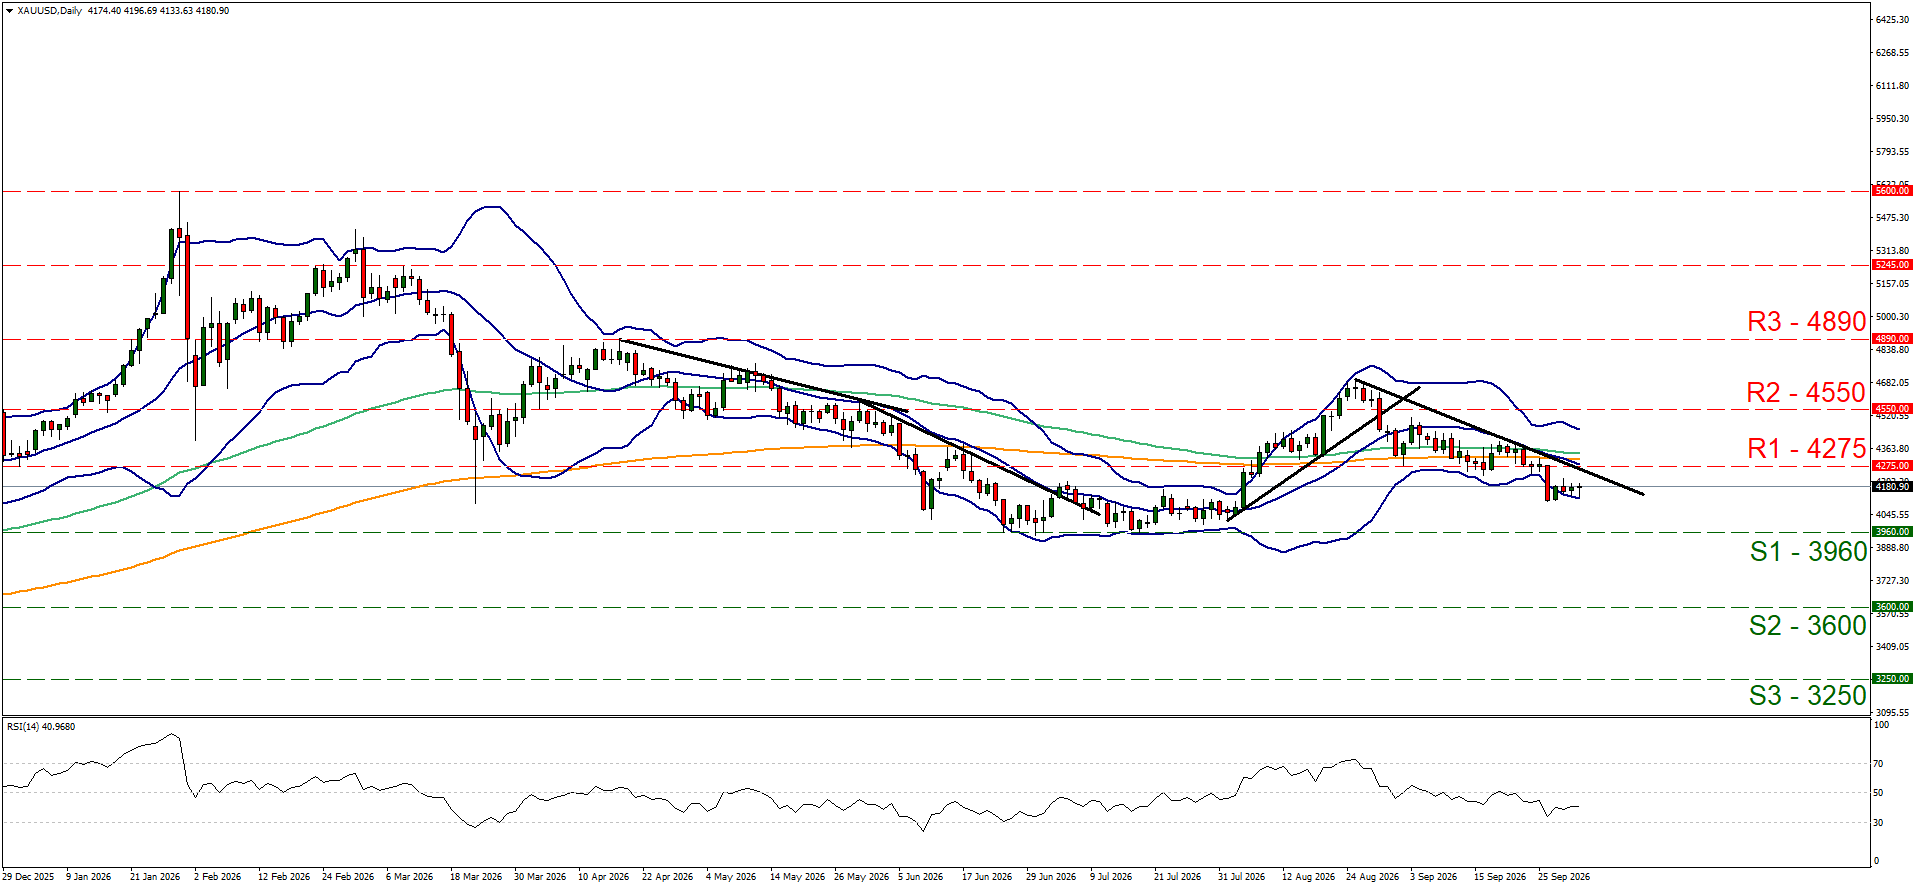
- Support: 3960 (S1), 3600 (S2), 3250 (S3).
- Resistance: 4275 (R1), 4550 (R2), 4890 (R3).
Author
Peter Iosif, ACA, MBA
IronFX
Mr. Iosif joined IronFX in 2017 as part of the sales force. His high level of competence and expertise enabled him to climb up the company ladder quickly and move to the IronFX Strategy team as a Research Analyst. Mr.

















