Sentiment Extreme Drags GBPUSD Lower

In this blog, I want to discuss the retreat in the COT Sentiment Net long position in the GBPUSD and what effects it can take.
First off let me start explaining what the COT report is all about. The Commitments of Traders Report, short COT is a weekly market report which is issued by the Commodity Futures Trading Commission. It displays the holdings of participants in various futures markets in the United States. It is collated by the CFTC from submissions from traders in various instruments, starting from commodities to forex futures markets and many more. They are primarily based in Chicago and New York.
Very important: The COT report is issued every Friday at 3:30 p.m. Eastern Time, and that report reflects the commitments of traders on the prior Tuesday. So it lagging as it is reflecting always the data of the last weeks reading.
The report provides a breakdown of positions held by three different types of traders. Which are the following once: Commercial Traders, Non-Commercial Traders, and Non-reportable. Commercial traders an the nonreportable are not of interest. Because commercial traders are traders who mainly hedge their position against high volatility and try to protect their profits through their futures contracts against price falls.
They are primarily producing and manufacturing companies. Nonreportable traders are mostly retail traders. Due to the small trading position they trade, they are not listed in the COT report individually.
So the most important positions to look at are the Non-Commercial Traders (Large speculative traders). Those are large institutional investors, insurance companies. hedge funds and other entities which trade the futures market for making money. These are the so-called market markets. They dominate the overall trend of a market. Therefore, we need to pay attention to them.
Overall, the COT report can tell us how investors sentiment currently is. We can determine sentiment extremes which “can” lead to a top or bottom in the larger timeframes. Keep in mind that not every sentiment extreme results in a top or bottom, so we need to be aware of this. Also, the COT report can be just a justification for trend reversion. You can’t trade based on the information! Therefore, it is very important to understand the concept of market timing.
GBPUSD Futures Large Speculative Traders
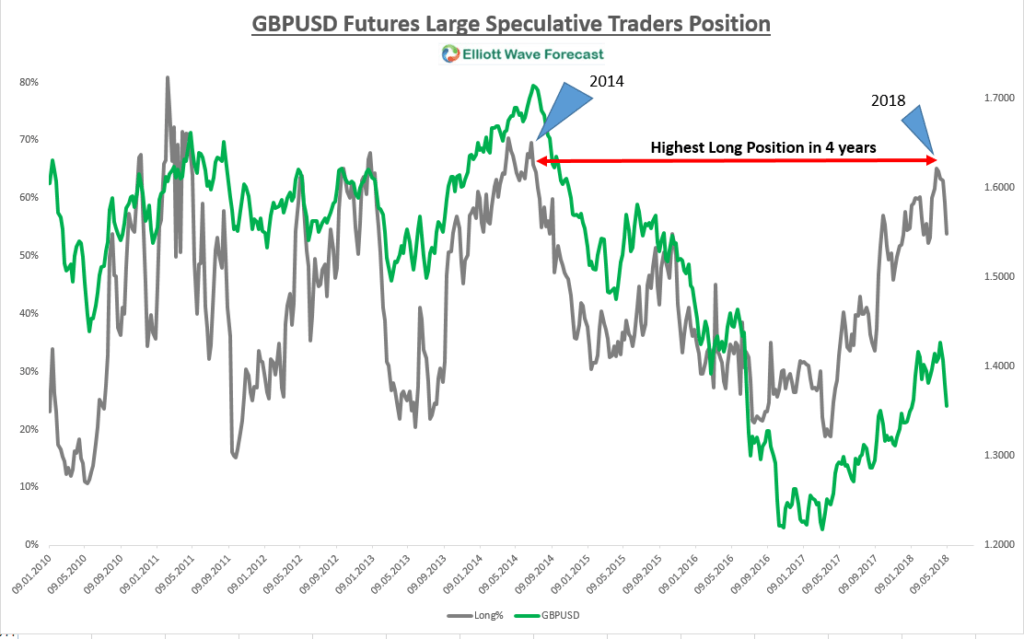
The chart below is showing the percentage of large speculative trader’s positions held in the Sterling. Which are large institutional investors, insurance companies, hedge funds and other entities. The equation is based on a % basis which shows the percentage of long and short holding in the futures market. Let’s have a look.
In the chart above you can clearly see that the GBP futures long position have been the highest since 2014. The grey color line is the long positions in % holding from the large speculative traders. The green one is the GBP. The retreat from the 4-year long position peak is remarkable. This was also shown in the late depreciation of the GBPUSD in the last weeks. This coincides what our Elliott Wave view chart is suggesting below.
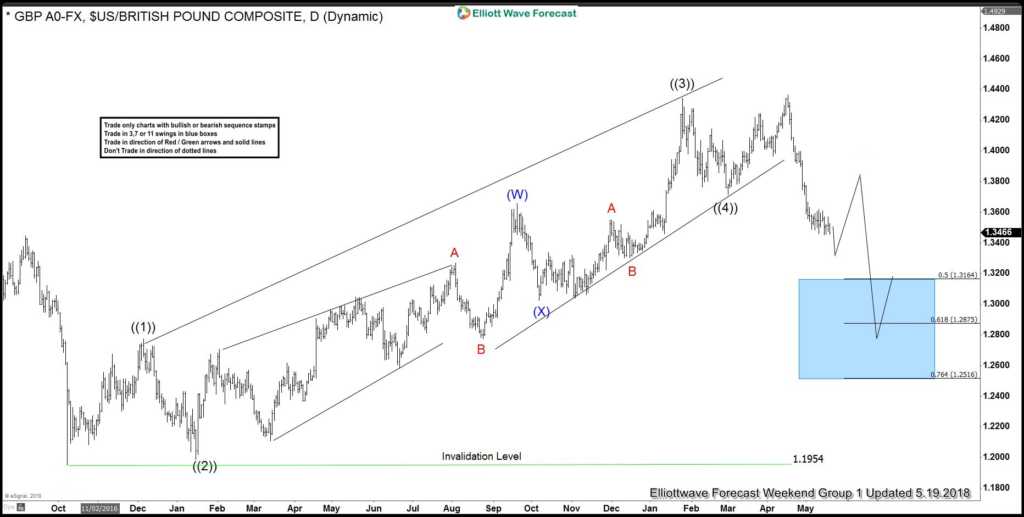
In the recent weekend updated chart of the GBPUSD which we presented to our members. You can see that overall more downside is expected. Please keep in mind that the markets never move in a straight line higher or lower. There is always a correction against the main trend. Some Elliott Wave labels have been removed to protect our client’s privilege.
GBPUSD Weekend Update 05.19.2018
Please always keep in mind that the COT is a highly lagging report as it is showing the positions of traders from the prior week. But the COT can help to identify sentiment extremes like in the example of the GBPUSD and a possible reversion and consequently follow through. But again you can’t trade based on the information.
I hope you enjoyed this kind of a different blog and I wish you all good trades and if you interested in learning more about our unique way of forecasting. You can join for FREE to a 14 days Trial below.
Become a Successful Trader and Master Elliott Wave like a Pro. Start your Free 14 Day Trial at - Elliott Wave Forecast.
Author

Elliott Wave Forecast Team
ElliottWave-Forecast.com

















