Sell EUR/NOK when (if) oil stops falling…
Working from the following simple model below, the Norwegian krone should be trading much better against the euro:

Assume we cannot forecast the future exchange rate in the equation, it leaves us with nominal interest rates and inflation to work with (but nominal interest rates and inflation are all wrapped up in the same feedback loop with expected economic growth); therefore we simplify for this purpose

Thus, the real yield available from Norwegian 2-year paper is 0.61% (or 61 basis points) greater than owning 2-year Eurozone paper. Given that, theoretically, speculative capital should be flowing to Norway in greater relative proportion, from hot money investors, than what is flowing into the Eurozone. In a world of zero bound interest rates, a 61 basis point pickup on relatively short-term paper is a big deal.
But theory and reality are two different things of course.
Despite economists tidy exclamations of ceteris paribus (roughly translated as other conditions remaining the same), in the real world of pseudo free market prices, all relationships which are embodied by said prices are continuously fluctuating; conditions never remain the same. To add to complexity, there are continuous feedback loops everywhere (von Mises taught us that). So, we make forecasts (dressed up guesses); but we must understand our guesses, and those of others, impact future prices, which in turn engenders updated forecasts, into infinitum really [see Reflexivity]. I hope that made a modicum of sense.
In the graphic on page 3 it shows the price action of three different variables overlaid: EUR/NOK, oil, and the Eurozone-Norway 2-year interest rate spread. And despite the importance of yield spread on relative currency prices, the biggest driver in EUR/NOK relationship seems to be oil. It makes sense, given the huge component to Norway’s economy; lower oil prices should mute growth expectations.
However, according to Trading Markets growth expectations for Q3 and Q4 2017 are the same for Norway and the Eurozone. And in fact, Q1 and Q2 for 2018 are higher for Norway (as you can see in the chart below).

EUR/NOK (gold) vs. Oil Inverted (green) vs. 2-yr Yield Spread (purple) Daily: As you can see, despite yield and growth, the tighter correlation between EUR/NOK is oil; i.e. as oil prices fall (green line going higher in this chart) EUR/NOK goes higher (or put another way, the Norwegian krone weakens relative to the euro).
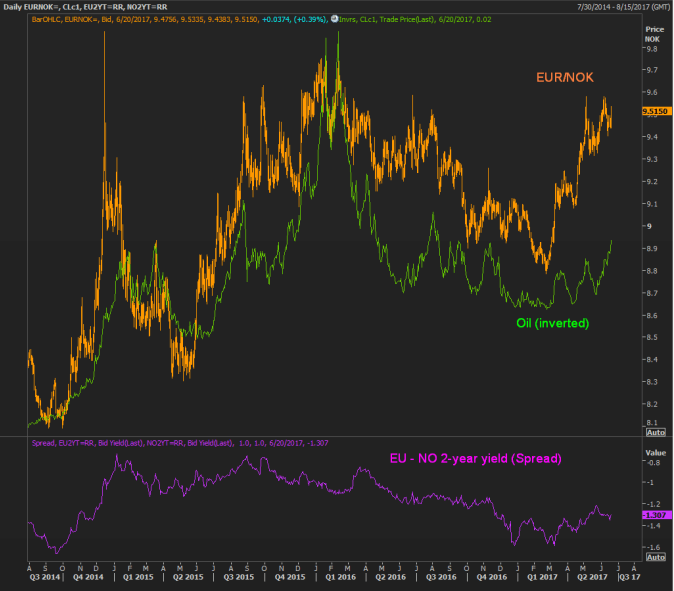
But, as indicated above, the dynamic may be more than what we see in this chart.
For instance, whenever you think about the variables that impact currency prices, keep in mind that the relationship is often circular. What I mean is that the variables tend to serve as both cause and effect in relation to other variables…a rising currency can improve the economic fundamentals and improving economic fundamentals tend to improve the outlook for the underlying currency. It leads to the mind numbing question: “What leads and what follows?”
Black Swan Capital’s Currency Currents is strictly an informational publication and does not provide personalized or individualized investment or trading advice. Commodity futures and forex trading involves substantial risk of loss and may not be suitable for you. The money you allocate to futures or forex trading should be money that you can afford to lose. Please carefully read Black Swan’s full disclaimer, which is available at http://www.blackswantrading.com/disclaimer
Yet there another consideration: The Norwegian central bank (aka Norges Bank) is expect to raise interest rates before the European Central Bank gets into the game (see Financial Times, Norway’s Norges Bank set to turn ‘cautiously hawkish’, 19 June 2017.) Thus, the yield spread favoring the krone over the euro is poised to rise as some unknown time in the not too distant future.
Bottom line: The current yield spread favors Norway; expected yield spread favors Norway; and growth expectations favor Norway. It strongly suggest once oil prices stop going down (we don’t know when that will be; but we do know they will stop going down at some point) one of the best intermediate-term trade setups should be short EUR/NOK.
Author

Jack Crooks
Black Swan Capital
Experience Jack has over 30 years of experience in the currency, equity, and futures arena. He has held key positions in corporate financial analysis, brokerage, investment research, money management, and trading.


