Retail Sales Saves the Day

Good Morning Traders,
As of this writing 4:45 AM EST, here's what we see:
US Dollar: Dec. USD is Up at 96.800.
Energies: Dec '18 Crude is Up at 57.23.
Financials: The Dec 30 year bond is Up 2 ticks and trading at 138.27.
Indices: The Dec S&P 500 emini ES contract is 36 ticks Lower and trading at 2725.50.
Gold: The Dec Gold contract is trading Up at 1216.70. Gold is 17 ticks Higher than its close.
Initial Conclusion
This is not a correlated market. The dollar is Up+ and Crude is Up+ which is not normal and the 30 year Bond is trading Higher. The Financials should always correlate with the US dollar such that if the dollar is lower then bonds should follow and vice-versa. The S&P is Lower and Crude is trading Higher which is correlated. Gold is trading Up+ which is not correlated with the US dollar trading Higher. I tend to believe that Gold has an inverse relationship with the US Dollar as when the US Dollar is down, Gold tends to rise in value and vice-versa. Think of it as a seesaw, when one is up the other should be down. I point this out to you to make you aware that when we don't have a correlated market, it means something is wrong. As traders you need to be aware of this and proceed with your eyes wide open.
At this hour all of Asia is trading Higher with the exception of the Nikkei exchange which is Lower at this time. Currently all of Europe is trading Higher.
Possible Challenges To Traders Today
-
Capacity Utilization Rate is out at 10 AM EST. This is major.
-
Industrial Production m/m is out at 10 AM EST. This is major
Treasuries
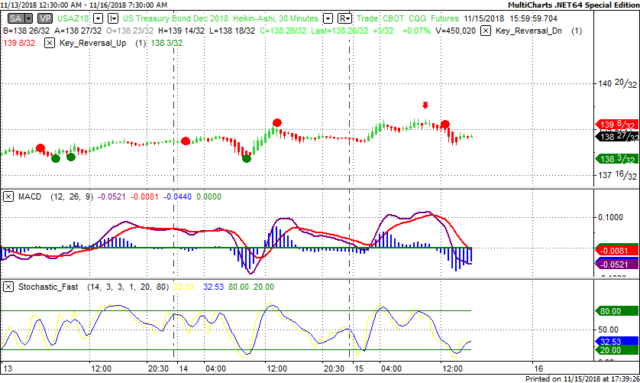
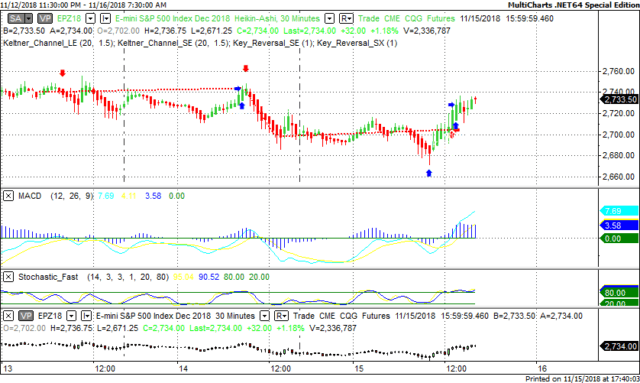
We've elected to switch gears a bit and show correlation between the 30 year bond (ZB) and The YM futures contract. The YM contract is the DJIA and the purpose is to show reverse correlation between the two instruments. Remember it's liken to a seesaw, when up goes up the other should go down and vice versa.
Yesterday the ZB made it's move at around 10 AM EST. The ZB hit a High at around that time and the YM hit a Low. If you look at the charts below ZB gave a signal at around 10 AM EST and the YM was moving Higher at the same time. Look at the charts below and you'll see a pattern for both assets. ZB hit a High at around 10 AM and the YM was moving Higher at the same time. These charts represent the newest version of MultiCharts and I've changed the timeframe to a 30 minute chart to display better. This represented a Shorting opportunity on the 30 year bond, as a trader you could have netted about 20 plus ticks per contract on this trade. Each tick is worth $31.25.
Charts Courtesy of MultiCharts built on an AMP platform
Bias
Yesterday we gave the markets a Neutral bias as all instruments we track were pointed higher. Whenever you have a situation whereby everything is pointed higher or conversely pointed lower; there is no market correlation. Hence the Neutral bias. Today we aren't dealing with a correlated market and our bias is to the Downside.
Could this change? Of Course. Remember anything can happen in a volatile market.
Commentary
Even though we had a news tsunami on Thursday the saving grace was Retail Sales which came in far better than expected showing an increase of 0.8 percent versus 0.6 percent. It may not seem like much but given what has transpired recently in the markets, every little bit helps. Immediately after 10 AM EST the markets took off and didn't look back. Today we only have two reports: Capacity Utilization and Industrial Production.
Author

Nick Mastrandrea
Market Tea Leaves


