Results and update: Scorpio is the ruling sign for bonds

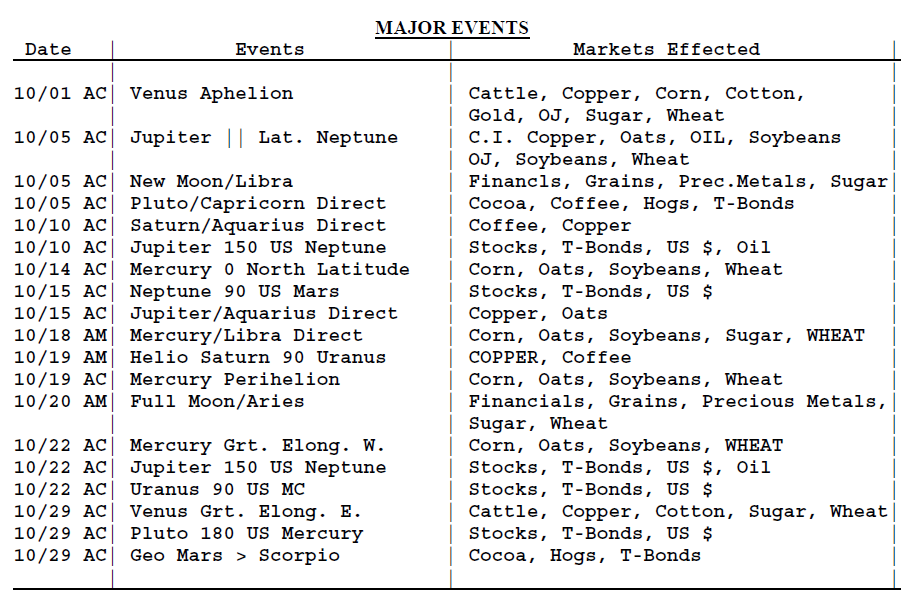
The October major planetary events can be sorted into five segments.
Editor’s Note: Please assume Stocks are affected by all listed events, unless stated otherwise.
1. A. 10/01 AC -" Venus Aphelion. Major change in trend Cattle, Copper, Corn, Cotton, Gold, OJ, Sugar, Wheat.
B. 10/05 AC -" Jupiter Parallel Latitude Neptune. Major change in trend COMMODITY INDEX, Copper, Oats, and OIL.
C. 10/05 AC -" New Moon in Libra. Major change in trend Financials, Grains, Precious Metals and especially Sugar & Wheat.
D. 10/05 AC -" Pluto in Capricorn turns Direct. Major change in trend Cocoa, Coffee, Hogs, and T-Bonds.
2. A. 10/10 AC -" Saturn in Aquarius turns Direct. Major change in trend Coffee and Copper.
B. 10/10 AC -" Jupiter 150 US Neptune. Moderate change in trend US Stocks, T-Bonds, US Dollar, & Oil.
C. 10/14 AC -" Mercury 0 North Latitude. Major change in trend Corn, Oats, Soybeans, Wheat.
D. 10/15 AC - Neptune 90 US Mars. Major change in trend US Stocks, T-Bonds, US Dollar.
E. 10/15 AC -" Jupiter in Aquarius turns Direct. Major change in trend Copper and Oats.
3. A. 10/18 AM -" Mercury in Libra turns Direct. Major change in trend Corn, Oats, Soybeans, Sugar, and WHEAT.
B. 10/19 AM -" Helio Saturn 90 Uranus. Major change in trend Coffee and COPPER.
C. 10/19 AC -" Mercury Perihelion. Major change in trend CORN, Gold, Oats, OJ, Soybeans, Wheat.
D. 10/20 AM - Full Moon in Aries. Major Change in Trend Financials, Grains, Precious Metals and especially Sugar and Wheat.
4. A. 10/22 AC -" Mercury Greatest Elongation West. Major change in trend Corn, Oats, Soybeans, Wheat.
B. 10/22 AC -" Jupiter 150 US Neptune. Moderate change in trend US Stocks, T-Bonds, US Dollar, & Oil.
C. 10/22 AC -" Uranus 90 US MC. Major change in trend US Stocks, T-Bonds, US Dollar.
5. A. 10/29 AC -" Venus Greatest Elongation East. Major change in trend Cattle, Copper, Cotton, Sugar, Wheat.5.
B. 10/29 AC -" Pluto 90 US Mercury. Major change in trend US Stocks, T-Bonds, US Dollar.
C. 10/29 AC -" Geo Mars enters Scorpio. Important change in trend Cocoa, Hogs, and T-Bonds.
October 2021 market monitor list
The October planetary analysis indicates that the best areas to monitor this month are: 1) Stocks; 2) Wheat; 3) Oats; 4) T-Bonds; 5) Corn; 6) Soybeans; 7) US $; 8) Oil; 9) CI/CRB; 10) Sugar; 11 tie) Cattle & Cotton; 12) Copper; 13 tie) Gold & OJ; 14) Coffee; 15) Silver; and 16 tie) Cocoa, Hogs.
Stock
08/27 SPX CL 4509.37
10/01 SPX CL 4357.04
September Review -" “During the past month, the S&P 500 zig zagged higher, to close 8/27 at a new all-time high. The top Astro dates and events for the coming month are: 8/27 AC -" Venus 0 South Latitude, Neptune Contra- Parallel US Neptune; 9/03 AC " Mercury Aphelion, New Moon in Virgo, Helio Mars enters Libra; 9/09 AC " Saturn 180 US North Node and Pluto 180 US Mercury; 9/13 AC -" Mercury Greatest Elongation East; 9/14 AC -" Geo Mars enters Libra; 8/17 AC -" Pluto Contra-Parallel and Helio Jupiter enters Pisces; 9/20 AC " Full Moon in Pisces; 9/24 AC - Mercury in Libra turns Retrograde; and 10/01 AC -" Venus Aphelion.”
Results
Market math
" 9/16 -" 575 days (Music Math) from the 2/19/20 major high.
9/17 -" 576 days ( 24^2) from the 2/19/20 major high.
9/16 was very close in price and one day past a very good high. 9/17 was a pass.
Score -" 1 out of 1 good dates = 100%.
Fibonacci -" 8/31, 9/9, 9/13, 9/20, 9/24.
8/31 was not effective. 9/9 was a pass. 9/13 was close in price and one day past a low. 9/20 was not effective. due to the volatility risk. 9/24 was very close in price and one day past a very good high.
Score – 2 out of 4 good dates = 50%.
Astro – 8/30, 9/2, 9/7, 9/10, 9/13, 9/14, 9/15, 9/20, 9/27, 10/1 AC.
8/30 was not effective. 9/2 was the exact high of the month, an all-time new high, and a very good high. 9/7, 9/10 and 9/27 were passes. 9/13 was a one day low. 9/14 was a one day high. 9/15 was a one day low. 9/20 was not effective due to volatility. Score – 4 out of 6 good dates = 66.67%.
Total Score – 7 out of 11 good dates = 63.64%.
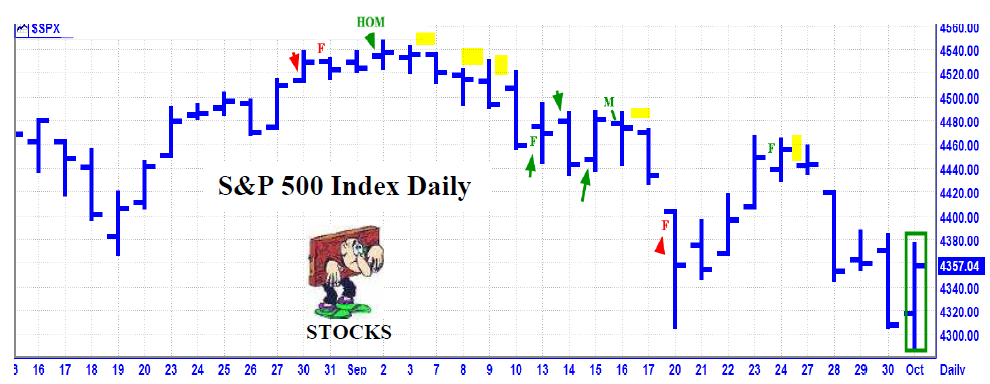
LEGEND: If it is Green it is a winner. If it is Red it is a miss. A Green encircled bar at the end of the month, is still open to evaluation due to a lack of time. A Yellow Bar is a Pass. Astro Date = Arrow. D = DJIA. Fibonacci = F. M = Market Math. N = NYSE. S = S&P. U = US Fed. B = BankEn/Fed. LOM = Low of the Month. HOM = High of the Month.
Stocks continued
October Update -" October should be a volatile, wild and swinging month for the Stock Market with five Planetary Polarity Points plus several more major aspects. Following is a summary of the top ten events or windows: 10/05 AC -" Jupiter Parallel Latitude Neptune, a New Moon, and Pluto turns Direct; 10/10 AC - Saturn turns Direct: 10/14 AC -" Mercury 0 North Latitude; 10/15 AC -" Neptune 90 US Mars and Jupiter turns Direct; 10/18 AM -" Mercury turns Direct; 10/19 AM -" Helio Saturn 90 Uranus; 10/19 AC -" Mercury Perihelion and 10/20 AM -" Full Moon; 10/22 AC -" Mercury Greatest Elongation West and Uranus 90 US MC; 10/29 AC -" Venus Greatest Elongation East, Pluto 180 US Mercury & Geo Mars enters Scorpio.
Near term, the Stock Market had a strong down trend for most of September. The rally on 10/1 into our 10/1 AC change in trend window suggest a high for Monday. If that is the case, there should be a decline into our huge 10/5 AC change in trend window. If the market rallies past Monday, then expect a rally high into 10/6.
Market math
10/6 – 4,597 Music Days from the 3/08/2009 major low.
Fibonacci – 10/6, 10/15, 10/18, 10/29.
Astro – 10/4, 10/6, 10/11, 10/14, 10/15, 10/20, 10/25, 10/29 AC.
T-Bonds
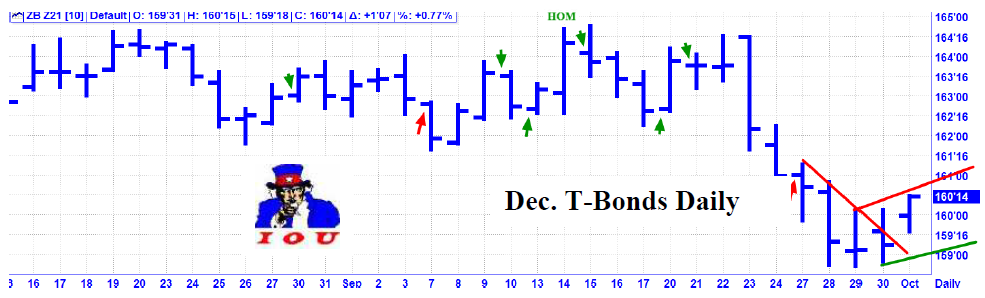
08/27 ZB Z21 CL 162-30.
10/01 ZB Z21 CL 160-14.
September Review -" “T-Bonds have been trading in a wide sideways trading range for the past month. This month, there are several major aspects to the US chart and the US chart is one of the Astrological keys for T-Bonds. The top Astro events for the coming month are: 8/27 AC -" Neptune Contra-Parallel US Neptune; 9/3 AC -" New Moon in Virgo; 9/9 AC -" Saturn 180 US North Node and Pluto 180 US Mercury; 9/17 AC " Pluto Contra-Parallel US Sun; and 9/20 AC -" Full Moon in Pisces. Key Dates - 8/30, 9/7, 9/10, 9/13, 9/16, 9/20, 9/21, 9/27, 10/1 AC”.
Results -" 8/30 was close in price and one day ahead of a short term high. 9/7 was not effective. 9/10 was very close in price and one day past a short term high. 9/13 was very close in price and one day past a good low. 9/16 was very close in price, one day past the high of the month, and a good high. 9/20 was very close in price and one day past a good low. 9/21 was very close in price and one day ahead of a very good high. 9/27 was not effective due to volatility. Score -" 6 out 8 good dates = 75%.
October Update -" T-Bonds had a sharp decline in the third week of September and then a small bounce into the 10/1 weekend. The top Astro events for T-Bonds this month are: 10/5 AC -" Pluto - Direct. Pluto is a planetary ruler for Bonds; 10/15 AC -" Neptune 90 US Mars; 10/22 AC -" Uranus 90 US MC; and Geo Mars enters Scorpio. The US chart is a major factor for T-Bonds. Scorpio is the ruling sign for Bonds.
Key Dates -" 10/4, 10/6, 10/8, 10/11, 10/15, 10/18, 10/20, 10/25, 10/29 AC .
US Dollar
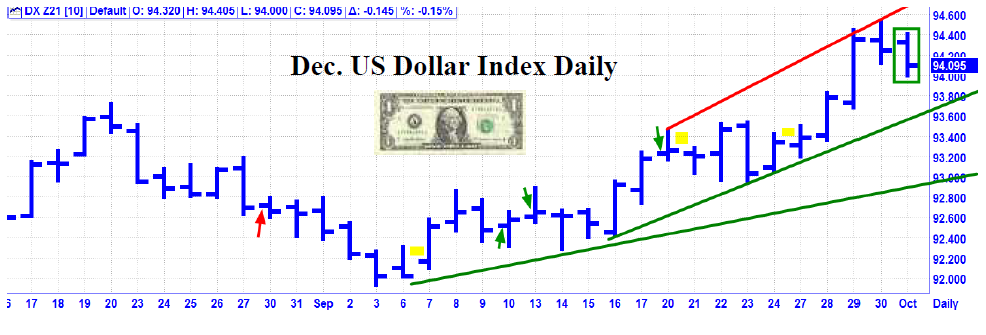
08/27 DX Z21 CL 92.695.
10/01 DX Z21 CL 94.095.
September Review – “The Dollar Index had a moderate up trend for most of August. This month, there are several major aspects to the US chart and the US chart is one of the Astrological keys for the US Dollar. The top Astro events for the coming month are: 8/27 AC -" Neptune Contra-Parallel US Neptune; 9/3 AC -" New Moon in Virgo; 9/9 AC -" Saturn 180 US North Node and Pluto 180 US Mercury; 9/17 AC -" Pluto Contra-Parallel US Sun; and9/20 AC -" Full Moon in Pisces. Key Dates -" 8/30, 9/7, 9/10, 9/13, 9/20, 9/21, 9/27, 10/1 AC”
Results -" 8/30 was not effective. 9/7, 9/21, and 9/27 were passes. 9/10 was a one day low. 9/13 was a short term high. 9/20 was a short term high. Score -" 3 out of 4 good dates = 75%.
October Update -" The US Dollar Index had a good uptrend for most of September. The top Astro events for the US Dollar are 10/6 -" New Moon; 10/15 AC -" Neptune 90 US Mars; 10/20 -" Full Moon; and 10/22 AC -" Uranus 90 US MC. The lunar cycle and the US chart are major factors for the US Dollar.
Key Dates -" 10/4, 10/6, 10/22, 10/15, 10/18, 10/20, 10/25.
Author

Norm Winski
Independent Analyst
www.astro-trend.com


