Record Gold rally fueled by safe‑haven buying

Gold’s rally fueled by expected U.S. rate cuts, concerns about Fed independence, and strong investor and central bank demand lifted spot gold to a record $3,530.19. Analysts now see $3,600–$3,900 near term, with potential to reach $4,000 in 2026 if uncertainties persist; the metal is up more than 33% year-to-date, and Reuters polls show the average 2025 forecast rising from $2,756 in January to $3,220 in July.
The dollar is about 11% weaker since Trump’s January return. Driven by expected Fed cuts, capital fleeing U.S. assets and tariff uncertainty making gold cheaper for non‑USD buyers.
Security risks from the Middle East and the Russia‑Ukraine war, combined with robust central‑bank buying including China’s ninth straight month of reserve additions in July are bolstering gold’s appeal. World Gold Council data show central banks plan to raise gold’s share of reserves and trim dollar holdings over the next five years.
Morgan Stanley says the precious‑metals market is in an upcycle driven by multiple positives and expects gold and silver to diverge during Fed rate cuts and macro shifts. Historically, within 60 days of Fed cuts gold averages a 6% gain (max 14%) and silver about 4%, a useful benchmark for today’s market.
Gold-backed ETFs have seen strong inflows: SPDR Gold Trust, the largest physically backed fund, boosted holdings to 977.68 tons—up 12% year-to-date and the highest since August 2022.
Technical analysis perspective:
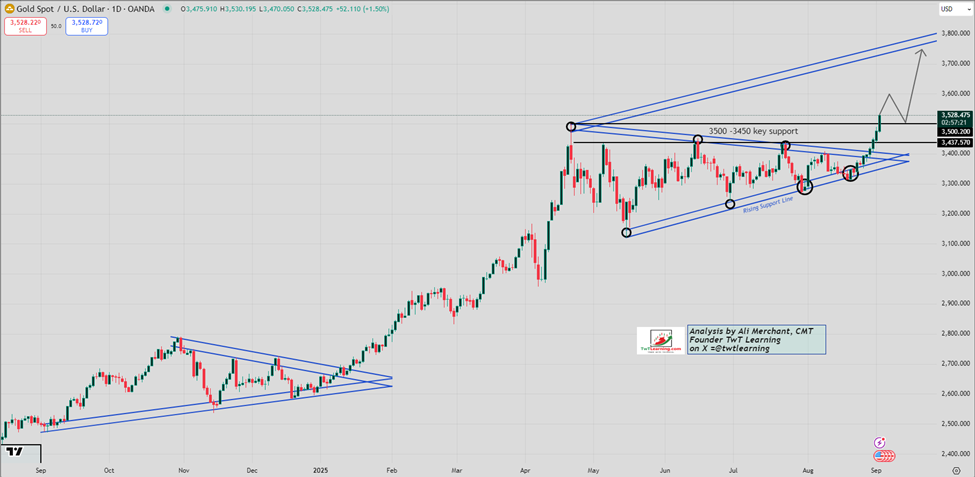
Gold / US Dollar:
- Gold often consolidates in triangle patterns before launching major rallies.
- It formed a triangle from Sept ’24–Jan ’25, then rallied to $3,500 in April.
- A second triangle held from April–Aug ’25 and was breached last week, leading to today’s record $3,530.19.
- The breakout targets $3,750–$3,800, provided $3,500 and $3,450 hold on any pullback.
Gold Daily chart:
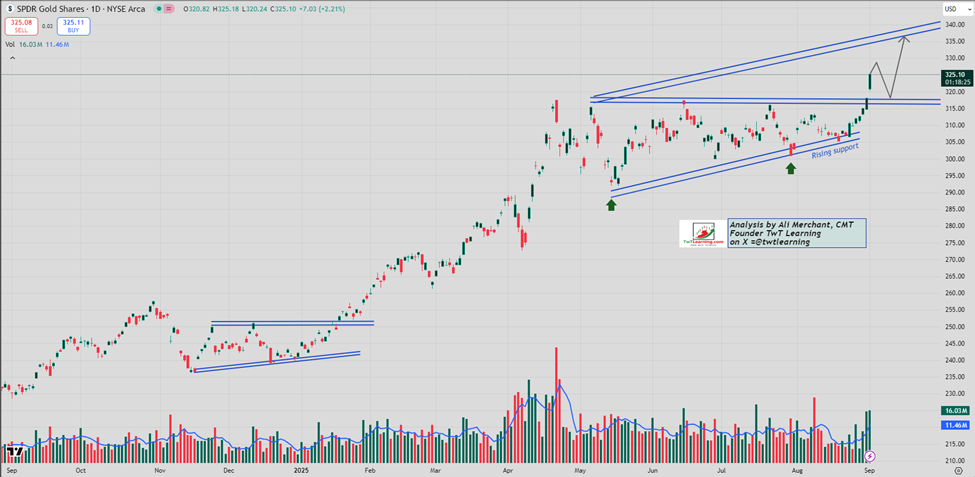
GLD (SPDR Gold Trust) ETF:
- GLD blasted past key resistance at 318 today after a triangle consolidation from Apr–Aug ’25.
- A similar Nov ’24–Jan ’25 pattern preceded a rapid move into the 317–318 area.
- The breakout targets a rally to 335–340.
- A short corrective dip to 320–318 is possible before the next leg up.
GLD daily chart:
GLD Seasonality:
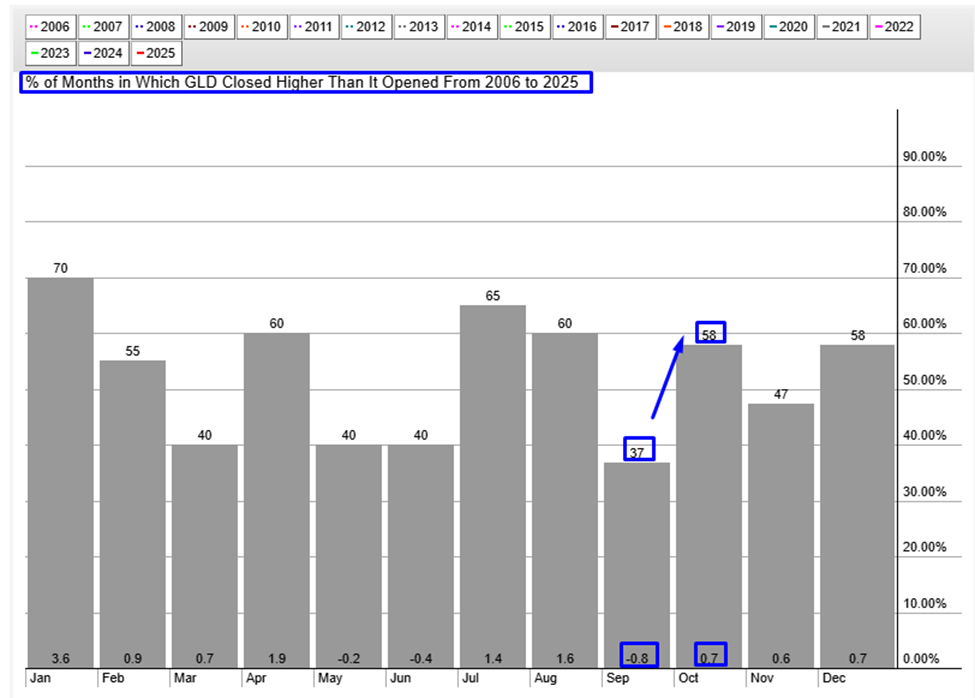
Since 2006, GLD has posted September decline of -0.8% in 37% of the years, while October has seen a rise of 0.70% in 58% of the years.
Author

Ali Merchant, CMT
TwT Learning
Ali Merchant is a seasoned financial market professional with expertise in Technical Analysis, Treasury & Capital Markets, Trading, Sales, Research, Training, & Fund Management, He has been trading FX, FX options, US stock


