Recession Probability Charts: Current Odds About 33%

The New York Fed has the odds of a recession within the next year at 33%. Some of the other models are humorous.
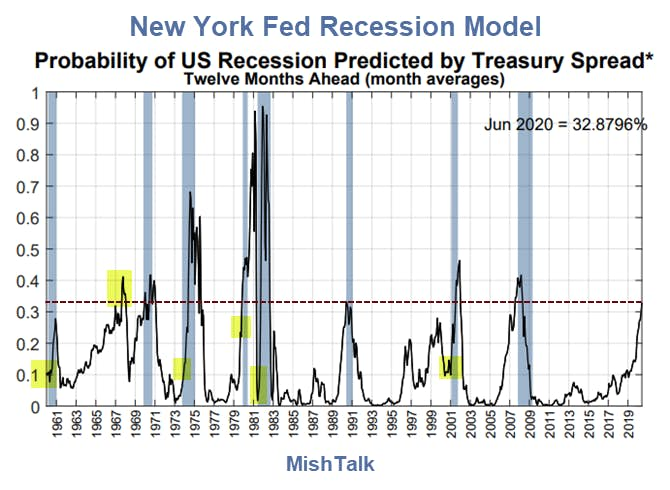
New York Fed Treasury Spread Model
The New York Fed Recession Model is based on yield curve inversions between the 10-year Treasury Note and the 3-Month Treasury Bill.
I added the highlights in yellow and the dashed red line.
The model uses monthly averages.
Smoothed Recession Odds
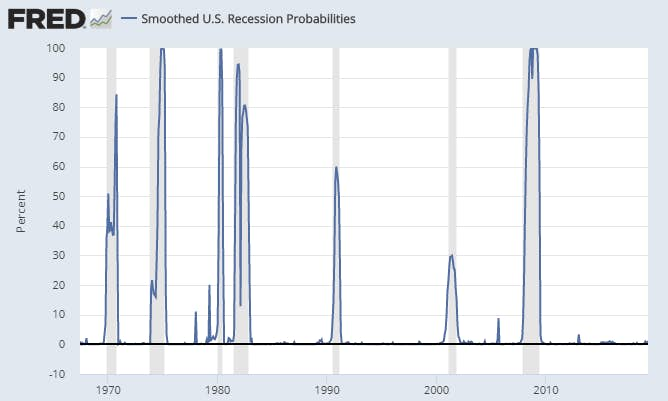
I do not know the makeup of the smoothed recession chart but it is clearly useless. The implied odds hover around zero, and are frequently under 20% even in the middle of recession.
GDP Recession Model
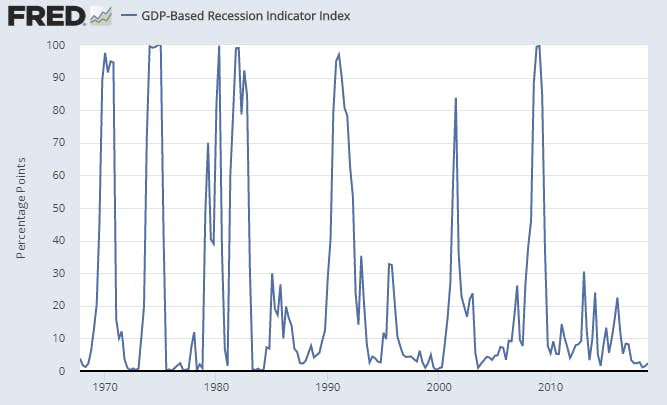
The GDP-based recession model is hugely lagging. The current estimate is 2.4%. This model will not spike until there is at least one quarter of negative or near-zero GDP.
Estimated Recession Probabilities
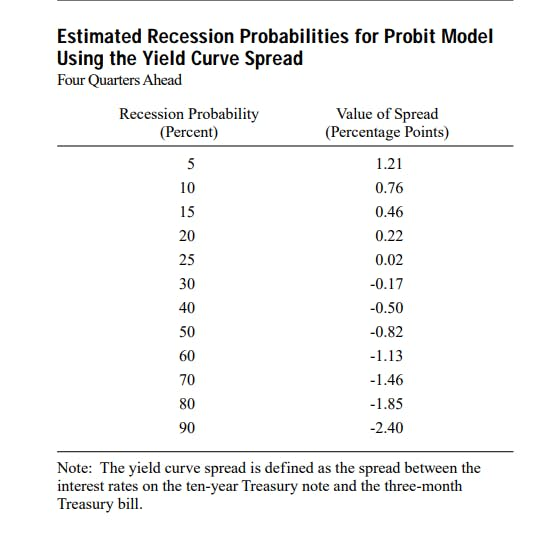
Predicting Recessions
The above chart is from the Yield Curve as a Predictor of U.S. Recessions by Arturo Estrella and Frederic S. Mishkin. It is from 1996 so the table may have been revised.
Practical Issues
One might also wish to consider the 2006 discussion the Yield Curve as a Leading Indicator: Some Practical Issues.
With regard to the short-term rate, earlier research suggests that the three-month Treasury rate, when used in conjunction with the ten-year Treasury rate, provides a reasonable combination of accuracy and robustness in predicting U.S. recessions over long periods.
Maximum accuracy and predictive power are obtained with the secondary market three-month rate expressed on a bond-equivalent basis, rather than the constant maturity rate, which is interpolated from the daily yield curve for Treasury securities.
Spreads based on any of the rates mentioned are highly correlated with one another and may be used to predict recessions. Note, however, that the spreads may turn negative—that is, the yield curve may invert—at different points and with different frequencies.
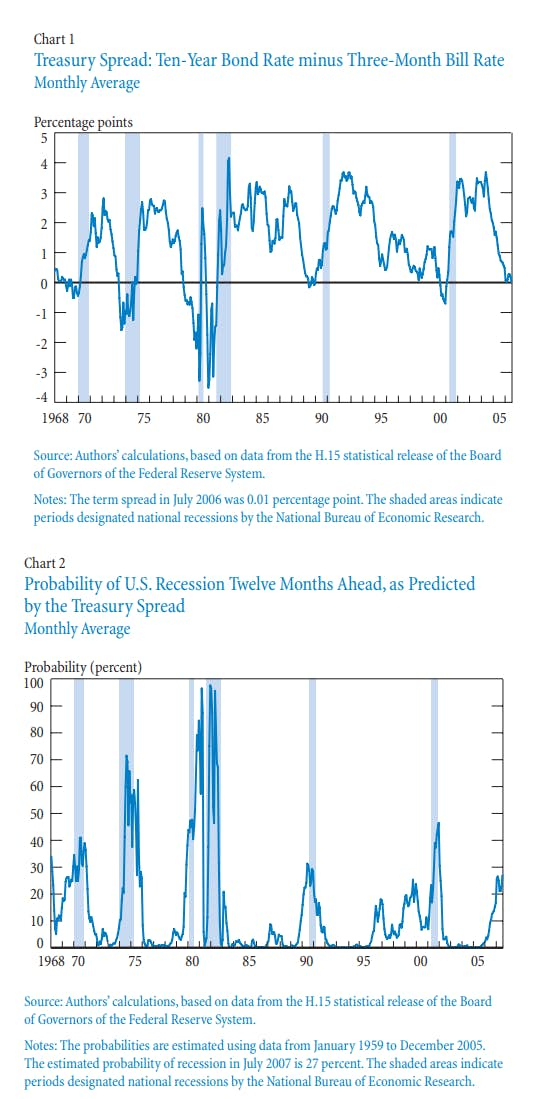
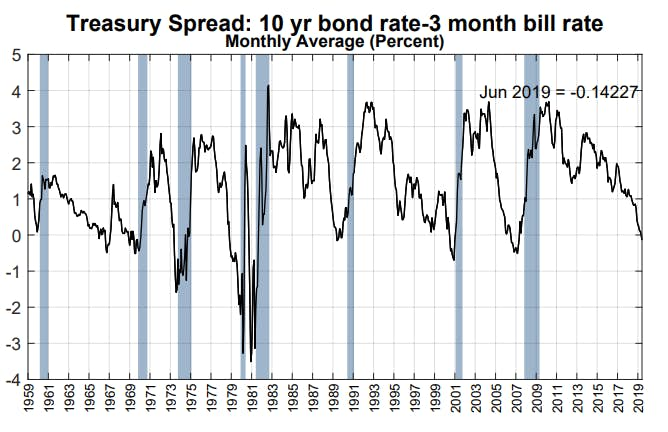
Our preferred combination of Treasury rates proves very successful in predicting the recessions of recent decades. The monthly average spread between the ten-year constant maturity rate and the three-month secondary market rate on a bond equivalent basis has turned negative before each recession in the period from January 1968 to July 2006 (Chart1). If we convert this spread into a probability of recession twelve months ahead using the probit model described earlier (estimated with Treasury data from January 1959 to December 2005), we can match the probabilities with the recessions (Chart 2). The chart shows that the estimated probability of recession exceeded 30 percent in the case of each recession and ranged as high as 98 percent in the 1981-82 recession.
Other Spreads
The article mentions "The ten-year minus two-year spread tends to turn negative earlier and more frequently than the ten-year minus three-month spread, which is usually larger."
That is certainly not the case today.
The 2-year yield is 1.882 whereas the 10-year yield is 2.041.
Chalk this up to QE, Fed manipulation, taper tantrums, and hedge funds front-running expected rate cut moves.
Author

Mike “Mish” Shedlock's
Sitka Pacific Capital Management,Llc
Mike “Mish” Shedlock is a registered investment advisor for SitkaPacific Capital Management.


