Recession Looms: Cass Freight Index Negative for 7th Month

According to Cass, "Freight shipments signal economic contraction".
The Economic Outlook from Freight’s Perspective is not promising.
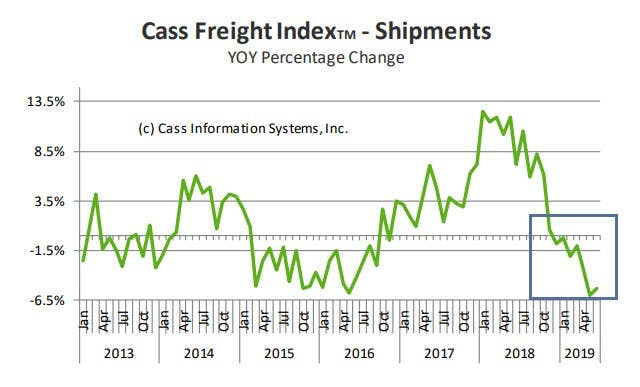
- With the -5.3% drop in June following the -6.0% drop in May, we repeat our message from last month: the shipments index has gone from “warning of a potential slowdown” to “signaling an economic contraction.”
- May and June’s drops are significant enough to pose the question, “Will the Q2 ’19 GDP be negative?”
- We acknowledge that all of these negative percentages are against extremely tough comparisons; and the Cass Shipments Index has gone negative before without being followed by a negative GDP.
- The weakness in spot market pricing for many transportation services, especially trucking, is consistent with the negative Cass Shipments Index and, along with airfreight and railroad volume data, strengthens our concerns about the economy and the risk of ongoing trade policy disputes. Weakness in commodity prices and the decline in interest rates have joined the chorus of signals calling for an economic contraction.
- We are concerned about the severe declines in international airfreight volumes (especially in Asia) and the ongoing swoon in railroad volumes, especially in auto and building materials.
- We see the weakness in spot market pricing for transportation services, especially in trucking, as consistent with and a confirmation of the negative trend in the Cass Shipments Index.
- As volumes of chemical shipments have lost momentum, our concerns of the global slowdown spreading to the U.S., and the trade dispute reaching a ‘point of no return’ from an economic perspective, grow.
European Airfreight
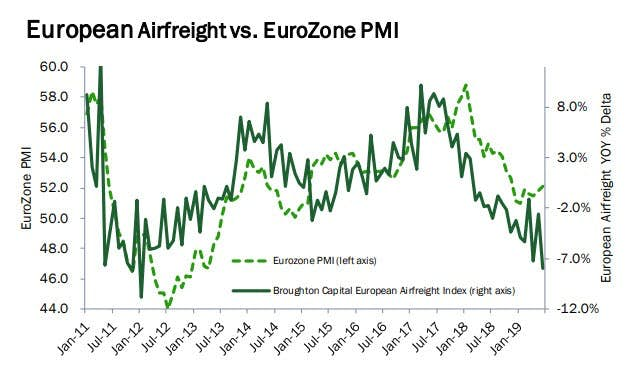
European airfreight volumes have been negative since March 2018, but only by a small single-digit margins (-1% to -3%), until November 2018. Unfortunately, since then, volumes have started to further deteriorate. Our European Airfreight Index was down a concerning -7.2% in April, only down -2.6% in May, before dropping -7.9% in June. Although by itself distressing, it’s the Asian data that has become the most alarming.
Asia Pacific Airfreight

Asian airfreight volumes were essentially flat from June to October 2018, but have since deteriorated at an accelerating pace (November -3.5%, December -6.1%, January -5.4%, February -13.3%, March -3.6%, -10.2% in April, -8.5% in May, and -8.6% in June).
Shanghai Airfreight
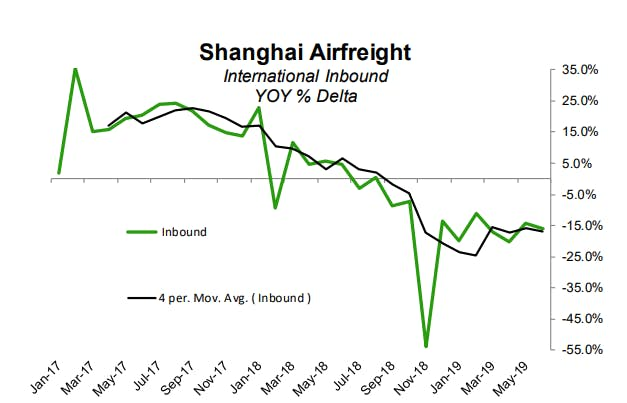
If the overall volume wasn’t distressing enough, the volumes of the three largest airports (Hong Kong, Shanghai, and Incheon) are experiencing the highest rates of contraction. Even more alarming, the inbound volumes for Shanghai have plummeted. This concerns us since it is the inbound shipment of high value/low density parts and pieces that are assembled into the high-value tech devices that are shipped to the rest of the world.
Free Markets
It is extremely refreshing to see analysis giving free trade a big plug. And in the face of Trumpian foolishnees, it is all the more refreshing.
This is what Cass had to say:
The data underlying economic history is clear: the more unrestricted and robust global trade is, the more prosperous the global population becomes. Open markets of free trade are the greatest method to efficiently allocate resources and ensure that the best quality goods made by the most efficient producers are available to everyone. Unrestricted global trade lifts hundreds of millions, even billions, of the world’s population out of poverty. ‘Protectionism,’ like so many government regulations and programs, frequently produces results that are the exact opposite of the intended outcome.
Shipment Index vs GDP
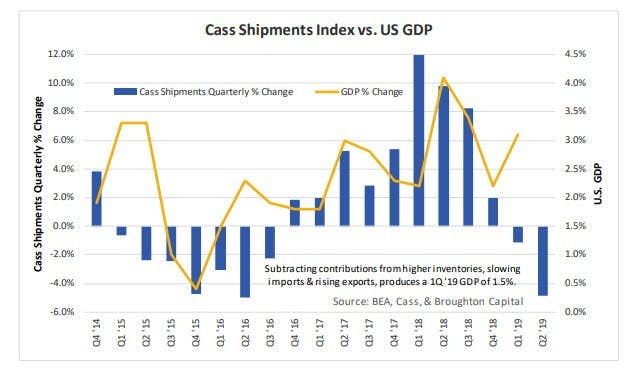
At first glance, the GDP for the 1st quarter seems very inconsistent with overall freight volumes. Using the Cass Shipments Index as a predictive proxy, we did not expect the BEA to report 3.2% as its initial estimate or 3.1% as its first revision. We won’t be surprised if the final report includes further downward revisions.
In the methodology used to calculate GDP, all increases in inventory are counted as additions to the GDP, all imports are counted as a negative to the GDP and all exports are counted as a positive to the GDP. Backing out the rising inventories, slowing imports and slightly higher exports, reduces the Q1 GDP to less than 1.5%.
Inventories

Inventories Piling Up
I agree with the Cass take on inventories.
Yet, the July 10 GDPNow Assessment of 1.4% includes a -1.01 adjustment for inventories.
Thus, the "Real Final Sales" estimate by the GDPNow model is 2.4%.
Real Final Sales is the true bottom line assessment of the economy.
Why a Negative Adjustment?
But why does GDPNow have a negative inventory build?
I have been struggling with that all quarter.
On July 3, I commented the Manufacturing Sector is Rolling Over But Inventories Keep Piling Up.
Inventory Wildcard
If inventories are somehow negative, real final sales, will be higher than the baseline report.
The reverse is also true. If the baseline GDP number is 1.3% and CIPI (Change in Private Inventories) ass 1.0%, we are talking a bottom line estimate of 0.3%, more in line with what Cass expects.
We will have a better idea tomorrow when a slew of economic reports on inventories, industrial production, and retail sales.
Bottom Line
Cass concludes with this bottom line assessment: "More and more data are indicating that this is the beginning of an economic contraction. If a contraction occurs, then the Cass Shipments Index will have been one of the first early indicators once again."
Author

Mike “Mish” Shedlock's
Sitka Pacific Capital Management,Llc
Mike “Mish” Shedlock is a registered investment advisor for SitkaPacific Capital Management.


