Recession fears drive markets lower [Video]
![Recession fears drive markets lower [Video]](https://editorial.fxstreet.com/images/Macroeconomics/EconomicIndicator/EconomicHealth/GDP/Recession/recession-gm173644047-8377642_XtraLarge.jpg)
US Dollar: Dec '22 USD is Up at 113.545.
Energies: Nov '22 Crude is Down at 78.35.
Financials: The Dec '22 30 Year bond is Down 26 ticks and trading at 127.31.
Indices: The Dec '22 S&P 500 emini ES contract is 136 ticks Lower and trading at 3675.00.
Gold: The Dec'22 Gold contract is trading Down at 1648.40. Gold is 72 ticks Lower than its close.
Initial conclusion
This is not a correlated market. The dollar is Up, and Crude is Down which is normal, but the 30-year Bond is trading Lower. The Financials should always correlate with the US dollar such that if the dollar is lower, then the bonds should follow and vice-versa. The S&P is Lower, and Crude is trading Lower which is not correlated. Gold is trading Lower which is correlated with the US dollar trading Up. I tend to believe that Gold has an inverse relationship with the US Dollar as when the US Dollar is down, Gold tends to rise in value and vice-versa. Think of it as a seesaw, when one is up the other should be down. I point this out to you to make you aware that when we don't have a correlated market, it means something is wrong. As traders you need to be aware of this and proceed with your eyes wide open. Currently all of Asia is trading Lower. All of Europe is trading Lower as well with the exception of the Milan exchange which is trading Higher at the present time.
Possible challenges to traders today
-
FOMC Member Collins Speaks at 10 AM EST. This is Major.
-
FOMC Member Mester Speaks at 4 PM EST. Not Major.
Treasuries
Traders, please note that we've changed the Bond instrument from the 30 year (ZB) to the 10 year (ZN). They work exactly the same.
We've elected to switch gears a bit and show correlation between the 10-year bond (ZN) and the S&P futures contract. The S&P contract is the Standard and Poor's, and the purpose is to show reverse correlation between the two instruments. Remember it's likened to a seesaw, when up goes up the other should go down and vice versa.
Last Friday the ZN made its move at around 11:30 AM EST. The ZN hit a Low at around that time and the S&P moved Lower at around the same time. If you look at the charts below ZN gave a signal at around 11:30 AM and the S&P moved Lower at around the same time. Look at the charts below and you'll see a pattern for both assets. ZN hit a Low at around 11:30 AM and the S&P was moving Lower shortly thereafter. These charts represent the newest version of MultiCharts and I've changed the timeframe to a 15-minute chart to display better. This represented a Long opportunity on the 10-year note, as a trader you could have netted about 20 ticks per contract on this trade. Each tick is worth $15.625. Please note: the front month for the ZN is now Dec '22. The S&P contract is also Dec' 22. I've changed the format to Renko Bars such that it may be more apparent and visible.
Charts courtesy of MultiCharts built on an AMP platform
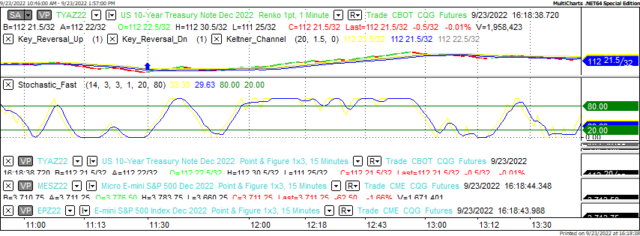
ZN - Dec 2022 - 09/23/22
-637997870275571787.png)
S&P - Dec 2022 - 9/23/22
Bias
Last Friday we gave the indices a Neutral bias as we saw little evidence of Market Correlation, hence the Neutral or Mixed Bias. The markets veered to the Downside as the Dow closed 486 points Lower and the other indices traded Lower as well. Today we aren't dealing with a correlated market and our bias is to the Downside.
Could this change? Of Course. Remember anything can happen in a volatile market.
Commentary
Well, we've been saying it for a while and last Friday the fear came out: traders are now concerned with the prospect of a recession. So much so that the Dow closed nearly 500 points Lower, and the other indices traded Lower as well. I hate to sound like a broken record but the harder the Fed pushes to raise rates, sooner or later they will demand and when that happens, layoffs occur, and we all know what follows. If the Fed wanted to engineer a soft landing; cut raise but so at a more reasonable pace. Instead of 3 quarter of a point, do one quarter point increments. They are anxious to stop or kill inflation but doing so they will impact the economy. Ben Bernanke said it best: what killed the economy in 1929 and caused the Great Depression was the utter lack of capital at a time when the economy needed it. I just hope we don't overlook the mistakes of the past.
Author

Nick Mastrandrea
Market Tea Leaves


