Presidents Day – Just what the markets need [Video]
![Presidents Day – Just what the markets need [Video]](https://editorial.fxstreet.com/images/Markets/Currencies/Majors/DollarIndex/close-up-look-of-markets-various-bills-1775965_XtraLarge.jpg)
US Dollar: Mar '23 USD is Up at 104.550.
Energies: Apr '23 Crude is Down at 76.21.
Financials: The Mar '23 30 Year T-Bond is Down 18 ticks and trading at 125.00.
Indices: The Mar '23 S&P 500 emini ES contract is 108 ticks Lower and trading at 4072.75.
Gold: The Apr'23 Gold contract is trading Down at 1835.40. Gold is 164 ticks Lower than its close.
Initial conclusion
This is not a correlated market. The dollar is Up, and Crude is Down which is normal, but the 30 Year T-Bond is trading Lower. The Financials should always correlate with the US dollar such that if the dollar is lower, then the bonds should follow and vice-versa. The S&P is Lower, and Crude is trading Lower which is not correlated. Gold is trading Lower which is correlated with the US dollar trading Up. I tend to believe that Gold has an inverse relationship with the US Dollar as when the US Dollar is down, Gold tends to rise in value and vice-versa. Think of it as a seesaw, when one is up the other should be down. I point this out to you to make you aware that when we don't have a correlated market, it means something is wrong. As traders you need to be aware of this and proceed with your eyes wide open. All of Asia is trading Lower with the exception of the Singapore exchange which is trading Higher. At the present time all of Europe is trading Lower.
Possible challenges to traders today
-
Import Prices m/m is out at 8:30 AM EST. This is Major.
-
FOMC Member Bowman Speaks at 8:45 AM EST. Major.
-
CB Leading Index m/m is out at 10 AM EST. Major.
Treasuries
Traders, please note that we've changed the Bond instrument from the 30 year (ZB) to the 10 year (ZN). They work exactly the same.
We've elected to switch gears a bit and show correlation between the 10-year bond (ZN) and the S&P futures contract. The S&P contract is the Standard and Poor's, and the purpose is to show reverse correlation between the two instruments. Remember it's likened to a seesaw, when up goes up the other should go down and vice versa.
Yesterday the ZN hit a High at around 9:30 AM EST. The S&P was trading Lower at around the same time. If you look at the charts below ZN gave a signal at around 9:30 AM and the S&P gave a signal at around the same time. Look at the charts below and you'll see a pattern for both assets. ZN hit a High at around 9:30 AM and migrated Lower. These charts represent the newest version of MultiCharts and I've changed the timeframe to a 15-minute chart to display better. This represented a Short opportunity on the 10-year note, as a trader you could have netted about a dozen ticks per contract on this trade. Each tick is worth $15.625. Please note: the front month for the ZN is now Mar '23. The S&P contract is now Mar' 23 as well. I've changed the format to filled Candlesticks (not hollow) such that it may be more apparent and visible.
Charts courtesy of MultiCharts built on an AMP platform
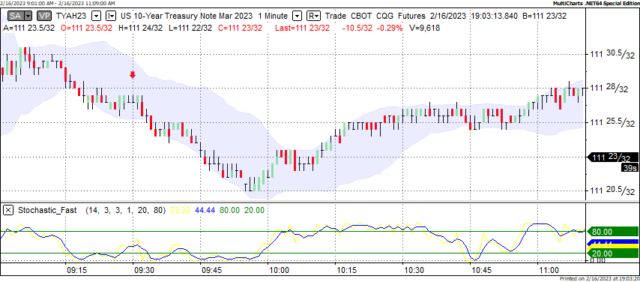
ZN - Mar 2023 - 2/16/23
-638122388270605546.png)
S&P - Mar 2023 - 2/16/23
Bias
Yesterday we gave the markets a Neutral or Mixed bias as we didn't see much in the way of correlation Thursday morning. The markets veered to the Downside as the Dow dropped 431 points and the other indices lost ground as well. Today we aren't dealing with a correlated market and will maintain a Neutral bias.
Could this change? Of Course. Remember anything can happen in a volatile market.
Commentary
Yesterday we gave the markets a Neutral or Mixed bias as we didn't see much in the way of Market Correlation Thursday morning. The markets veered to the Downside Thursday as much of the economic news reported did not meet expectation. Finally on Monday the markets get a day off and as I see it the markets need it. With all the bad news reported and economic reports not meeting expectation, the markets really need it. We will be back on Tuesday morning. Enjoy your holiday.
Author

Nick Mastrandrea
Market Tea Leaves


