President to meet with Putin in Russia, i mean Alaska

USD: Sept '25 is Up at 97.680.
Energies: Sep '25 Crude is Up at 62.91.
Financials: The Sep '25 30 Year T-Bond is Higher by 12 ticks and trading at 115.28.
Indices: The Sep '25 S&P 500 emini ES contract is 3 ticks Lower and trading at 6488.00.
Gold: The Dec'25 Gold contract is trading Down at 3404.00.
Initial conclusion
This is not a correlated market. The USD is Up and Crude is Up which is not normal, and the 30 Year T-Bond is trading Higher. The Financials should always correlate with the US dollar such that if the dollar is Higher, then the bonds should follow and vice-versa. The S&P is Lower and Crude is trading Higher which is correlated. Gold is trading Lower which is correlated with the US dollar trading Up. I tend to believe that Gold has an inverse relationship with the US Dollar as when the US Dollar is down, Gold tends to rise in value and vice-versa. Think of it as a seesaw, when one is up the other should be down. I point this out to you to make you aware that when we don't have a correlated market, it means something is wrong. As traders you need to be aware of this and proceed with your eyes wide open. Asia traded Mixed. Currently Europe is trading Higher.
Possible challenges to traders
-
Core PPI is out at 8:30 AM EST. This is Major.
-
PPI is out at 8:30 AM EST. This is Major.
-
Unemployment Claims are out at 8:30 AM EST. This is Major.
-
Natural Gas Storage is out at 10:30 AM EST. This is Major.
-
FOMC Member Musalem Speaks at 10 AM EST. This is Major.
-
FOMC Member Barkin Speaks at 2 PM EST. This is Major.
-
Mortgage Delinquencies - tentative
Traders, please note that we've changed the Bond instrument from the 10 Year (ZN) to the 2 Year (ZT). They work exactly the same.
We've elected to switch gears a bit and show correlation between the 2-year Treasury notes (ZT) and the S&P futures contract. The YM contract is the Dow Jones Industrial Average, and the purpose is to show reverse correlation between the two instruments. Remember it's likened to a seesaw, when up goes up the other should go down and vice versa.
Yesterday the ZT climbed Higher at around 8:30 AM EST with no news pending. The Dow dived Lower at the same time. Look at the charts below and you'll see a pattern for both assets. The Dow dived Lower at around 8:30 AM EST and the ZT climbed Higher at around the same time. These charts represent the newest version of Bar Charts, and I've changed the timeframe to a 15-minute chart to display better. This represented a Long opportunity on the 2-year note, as a trader you could have netted about 30 plus ticks per contract on this trade. Each tick is worth $6.25. Please note: the front month for ZT is now Sep '25 and the Dow is now Sep '25. I've changed the format to filled Candlesticks (not hollow) such that it may be more apparent and visible.
Charts courtesy of BarCharts
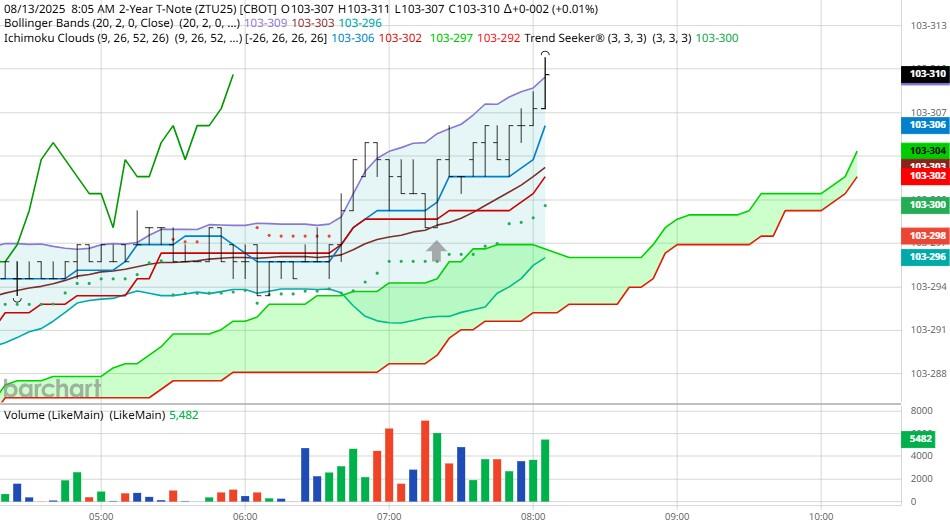
ZT -Sep 25 - 8/13/25
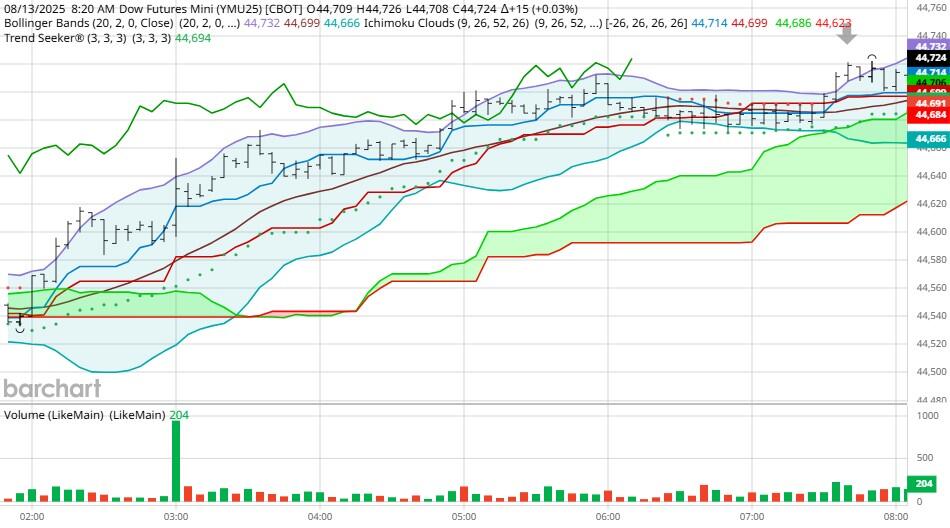
Dow - Sep 2025- 8/13/25
Bias
Yesterday we gave the markets an Upside bias and the markets didn't disappoint. The Dow gained 464 points on the session and the other indices gained ground as well. Today we aren't dealing with a correlated market and our bias is to the Downside.
Could this change? Of Course. Remember anything can happen in a volatile market.
Commentary
Earlier this week President Trump mentioned that he was to meet Putin this Friday in Russia. Seems someone forgot to tell him that the US bought Alaska from the Russians in 1867. Today we have the all-important PPI numbers which is liken to CPI only it's for producers and suppliers. Want to learn Market Correlation and determine market direction hours before the Opening Bell?
Author

Nick Mastrandrea
Market Tea Leaves
Nick Mastrandrea over 20 years experience in trading and formerly held a NASD Series 7. He currently holds a NJ Life, Health and Variable Authority. Nick is a published writer and his work has appeared in Futures Magazine, TraderPlanet and others.


